BRENT CRUDE OIL (LCOc1) ANALYSIS & TALKING POINTS
- OPEC and API reports to be overshadowed by U.S. inflation announcement as the USD dominates global market moves today.
- Higher inflation data could see a pullback in Brent crude oil prices while a miss on estimates may lead to a breakout above the $80 handle.
Recommended by Warren Venketas
Get Your Free Oil Forecast
WTI CRUDE OIL FUNDAMENTAL BACKDROP
Trade Smarter – Sign up for the DailyFX Newsletter
Receive timely and compelling market commentary from the DailyFX team
Subscribe to Newsletter
Brent crude oil is bid this morning finding support from a weaker U.S. dollar which will likely be the main driver of market pricing today. From a crude oil perspective, OPEC is scheduled to release its monthly market report later today that which will include their outlook for the market and it will be interesting to see whether significant revisions are made to demand/supply forecasts. Ending of the trading day the API weekly crude oil report will come into focus and another decline as seen last week could give oil prices a boost.
Foundational Trading Knowledge
Commodities Trading
Recommended by Warren Venketas
That being said, the primary theme for today will come via the U.S. CPI release that is expected to come in slightly softer; however, many market analysts and Fed officials have noted the rate of decline has not been as significant as projected which leads me to believe anything in line or above estimates could result in a hawkish slant to the data leaving crude oil prices exposed to the downside. Post-release, Fed speakers are programmed and it will be interesting to see their reaction to the inflation data.
U.S. ECONOMIC CALENDAR
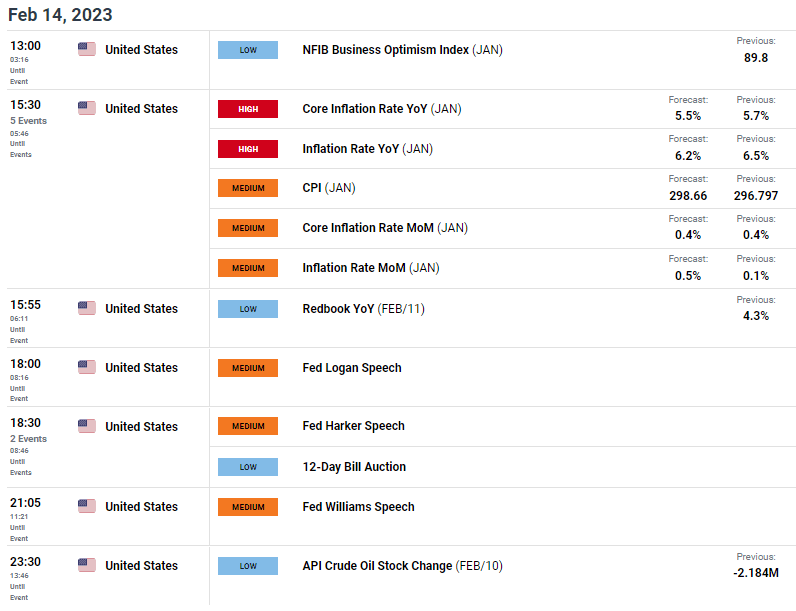
Source: DailyFX economic calendar
TECHNICAL ANALYSIS
BRENT CRUDE DAILY CHART
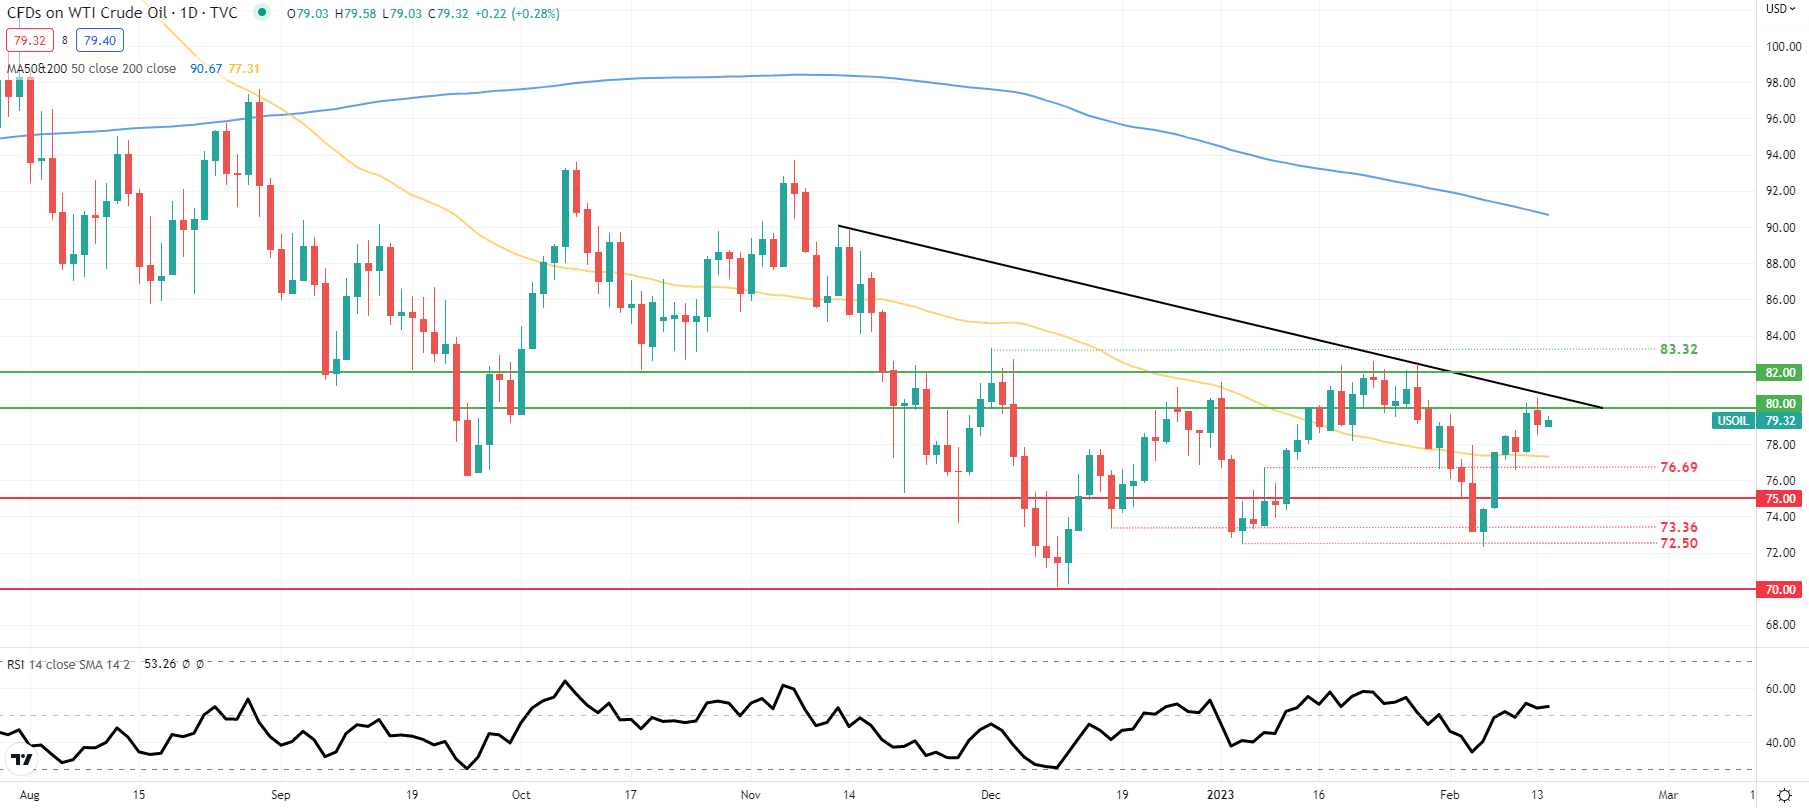
Chart prepared by Warren Venketas, IG
Daily Brent crude oil price action is trading marginally below the psychological $80/barrel resistance handle with caution being exercised by market participants shown via the Relative Strength Index (RSI) reading. Sandwiched between the 50-day SMA (yellow) and the medium-term trendline support (black), the aforementioned fundamental catalysts could drive market volatility to test one of these key zones and potentially break free from the recent rangebound pattern.
Key resistance levels:
- Trendline resistance
- 80.00
Key support levels:
IG CLIENT SENTIMENT: MIXED
IGCS shows retail traders are NET LONG on crude oil, with 68% of traders currently holding long positions (as of this writing). At DailyFX we typically take a contrarian view to crowd sentiment however, due to recent changes in long and short positioning we arrive at a short-term watchful disposition.
Contact and followWarrenon Twitter:@WVenketas