Gold, GDL, Oil and Dollar Talking Points:
- The Market Perspective: Gold Bearish Below 1,840; WTI Crude Oil Range Between 79 and 71
- The Dollar is the principal pricing instrument for most global commodities, which has brought an unexpected curb to development for both gold and oil
- Gold is stationed just above the 38.2% Fib of the past three-month bull wave at 1,839 while US-based WTI oil is pushing deeper into a broad congestion between 79 and 71
Recommended by John Kicklighter
How to Trade Gold
For those that pursue – or merely indulge – fundamental analysis, the most common question to ask is: what is driving the market currently. When it comes to the top global commodities, the first thought is usually to the academic considerations of ‘supply and demand’. While those are foundational concepts, there is a perhaps more rudimentary influence that is too often overlooked in the pricing instrument. While you can buy oil and gold in most major currencies; the global pricing of these commodities is typically done in US Dollars. That can exert serious influence over the path of these important assets that are considered to be foundational measures of the economy and financial system respectively.
Putting this relationship into perspective, below is a daily chart of the active gold futures contract on the Comex overlaid with the DXY Dollar Index. Technically, the metal is priced in the currency which would present as an ‘exchange rate’ of XAU/USD. Inverting the Dollar side of the chart would show a strong alignment between these two measures with a statical 20-day (equivalent to one trading month) correlation of -0.96 which is an extremely high measure of (inverse) relation. This relationship should be considered as we patiently – or impatiently – await gold’s next move as it waffles above the 38.2 percent Fibonacci retracement drawn from the 21 percent charge higher between November 3rd to February 2nd. Particularly when it comes to gold which plays more of a role as an alternative-to-traditional-currencies, the relationship to Dollar is particularly important for establishing conviction.
Chart of Gold Futures with Volume, 20 and 100-Day SMAs, 20-Day Disparity Overlaid with DXY (Daily)
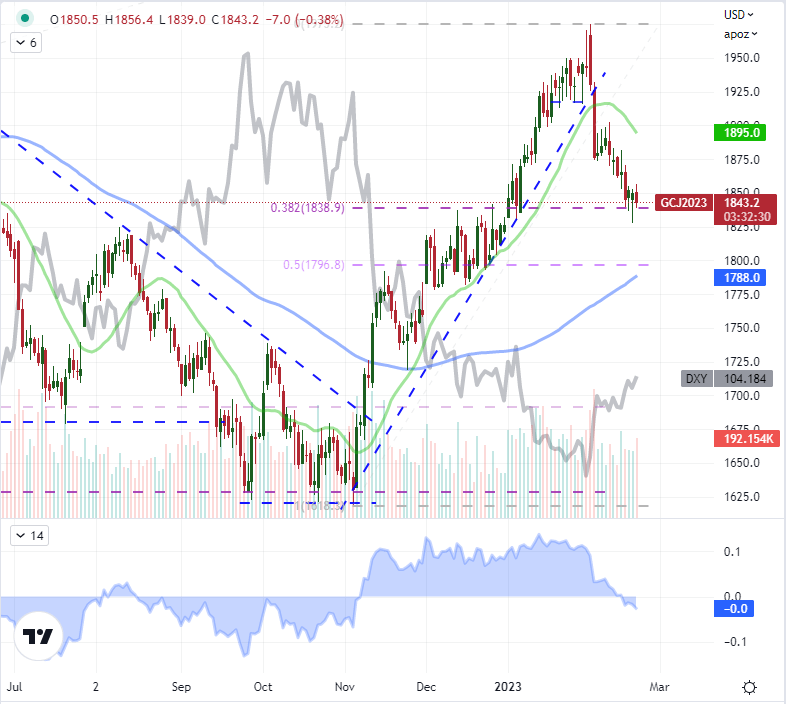
Chart Created on Tradingview Platform
Taking a look at another ‘derivative’ of the precious metal, the performance of the GLD ETF follows a very similar technical structure with an approximate 21 percent climb between November and February back to the 38.2 percent Fib of that aforementioned path in just the past three weeks. What is interesting to me from the derivatives market is participation and positioning measures. Due to a cyberattack, we haven’t had the Commitment of Traders report from the CFTC for a number of weeks now, but the open interest behind gold has broken a trend of steadily rising participation in the futures market, dropping to the lowest (on a monthly basis) since May 2020. Through the ETF, we have the short volume on GLD measured through FINRA. This can be useful in telling the market’s speculative appetite in leaning against a prominent marker for this particular underlying asset. Smoothing out the measure, the 5-day (equal to one trading week) short volume on GLD has dropped to approximately 550,000 shares, which is the lowest since the holiday period (Dec 30) and before that November 7th. Do the bears believe we have reached the extent of the metal’s retreat?
Chart of GLD ETF with Volume, 20 and 100-Day SMAs, Short Volume (Daily)
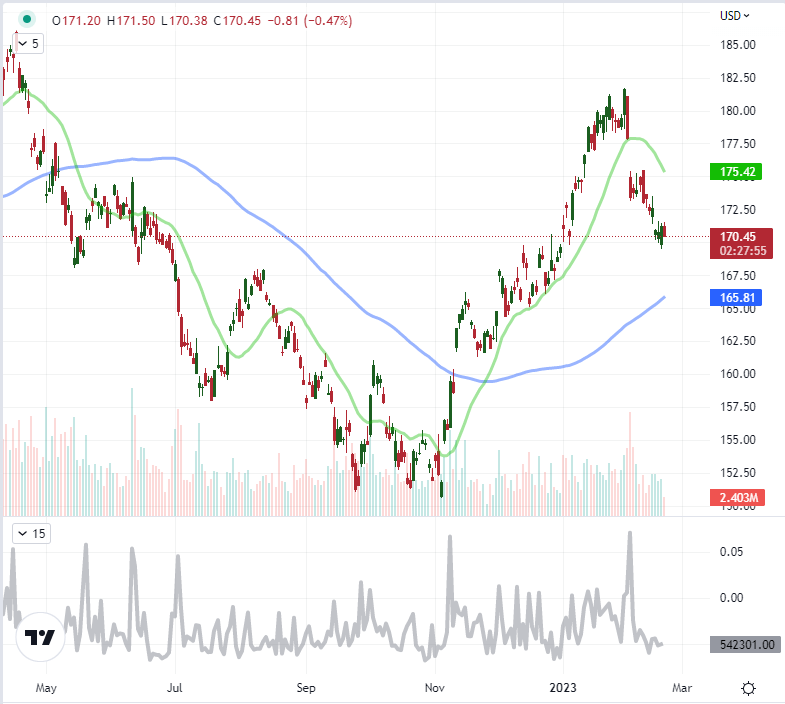
Chart Created on Tradingview Platform
When it comes to the fundamental influences on crude oil, the supply/demand function is a much more significant motivator of price action than its precious metal counterpart. That said, changes in the US inventory numbers and threats by Russia to cut output in order to exert influence on global inflation haven’t proven effective enough to resolve three months of distinct congestion – which also happens to fit within a much larger wedge. Once again, I overlaid the DXY Dollar Index over the oil chart below, but this time the currency component is inverted. Very notably, there was a significant divergence in the currency’s path (a big drop) and the commodity (which leveled out). The driver for the Dollar was the moderation of a premium afforded to interest rate expectations. Those rate expectations are informed by inflation on necessary items like petroleum productions but also the outlook for economic activity. Comparing the performance of the two, it would seem that the market was already aware of a drop in upstream inflation pressures with crude’s retreat and that there isn’t a serious concern of economic seizure, otherwise the demand aspect of crude’s pricing would have responded. Nevertheless, if the Dollar were to return to a genuine climb; it would likely restore downside pressure to oil and that 72 range floor whether through a functional pricing consideration or through risk aversion that throttles growth-dependent assets.
Recommended by John Kicklighter
How to Trade Oil
Chart of WTI US Oil Futures with Volume, 100-Day SMA, Overlaid with Inverted Dollar (Daily)
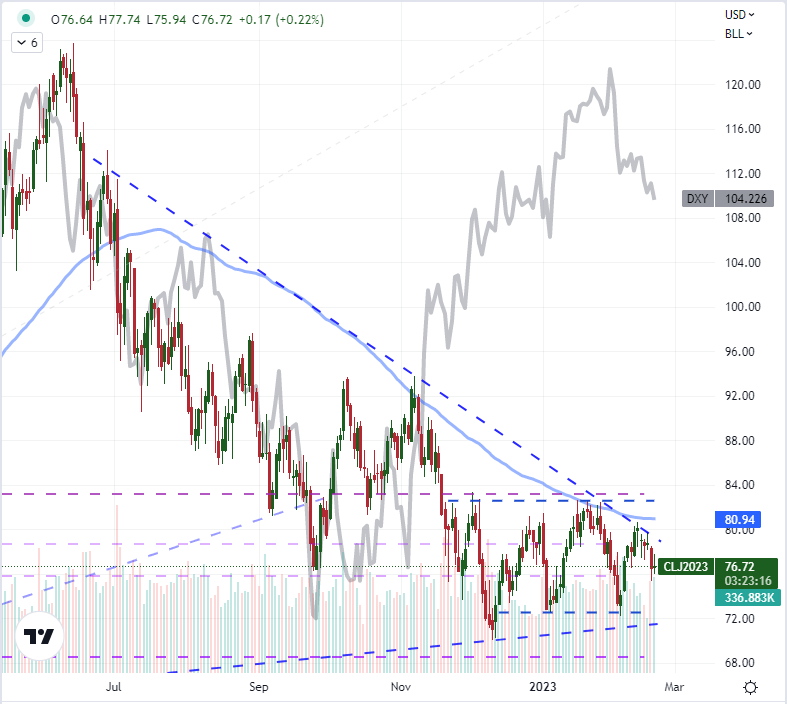
Chart Created on Tradingview Platform

Discover what kind of forex trader you are