
Gold, XAU/USD, US CPI, Fed, Rising Wedge, Technical Analysis – Briefing:
- Gold prices fell as the US Dollar and Treasury yields gained
- Will an upward inflation surprise bring down the yellow metal?
- XAU/USD is eyeing a bearish Riding Wedge before the CPI data
Recommended by Daniel Dubrovsky
How to Trade Gold
Gold prices fell 0.94% on Monday, the worst single-day performance in one week. A closer at the past 24 hours shows that XAU/USD succumbed to a combination of a rising US Dollar and Treasury yields. The anti-fiat yellow metal can be quite sensitive to the latter two moving in the same direction. That is largely why gold has been having it so rough this year for the most part.
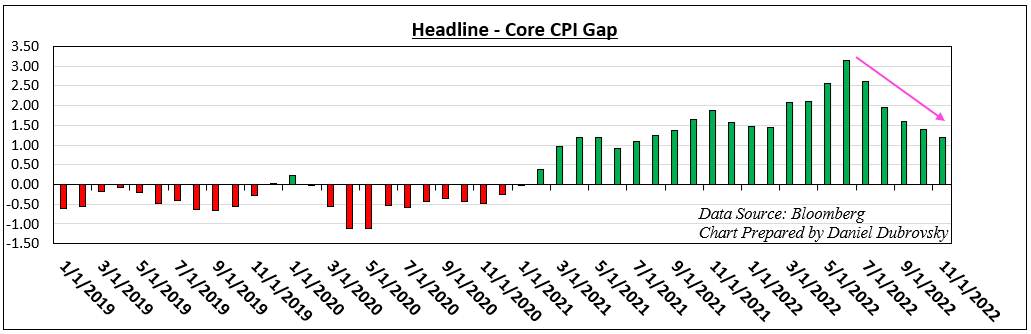
Markets likely readied up for the highly anticipated US CPI report, which is due at 13:30 GMT on Tuesday. The headline rate is seen slowing from 7.7% y/y to 7.3%. Meanwhile, the core gauge, which strips out volatile food and energy prices, is expected at 6.1% versus 6.3% prior. Moreover, the gap between headline and core is expected to narrow from 1.4 to 1.2.
The latter may pose a problem for the Federal Reserve down the road if the trend continues. Elevated core readings relative to headline rates could speak to stickier inflation that is harder to anchor down. One way to resolve this issue is for the central bank to deploy a longer-than-expected tightening cycle, posing a threat to gold.
Looking at the Citi Economic Surprise Index tracking the United States, the data continues to remain in positive territory. The latter means that generally, data has been beating expectations. That may speak to economists that are underestimating the health and vigor of the country. As such, this may open the door to an upward surprise for CPI. That risks bringing down gold.
Watching US Inflation Gaps
Gold Technical Analysis
On the daily chart, gold prices are flirting with breaking under a bearish Rising Wedge chart formation. A confirmatory downside close could open the door to resuming the dominant downtrend from March through the end of October. That would place the focus on the 50-day Simple Moving Average (SMA). The latter may then reinstate a near-term upward trajectory. Breaking above 1810 opens the door to uptrend resumption towards the June high at 1879.
Trade Smarter – Sign up for the DailyFX Newsletter
Receive timely and compelling market commentary from the DailyFX team
Subscribe to Newsletter
XAU/USD Daily Chart
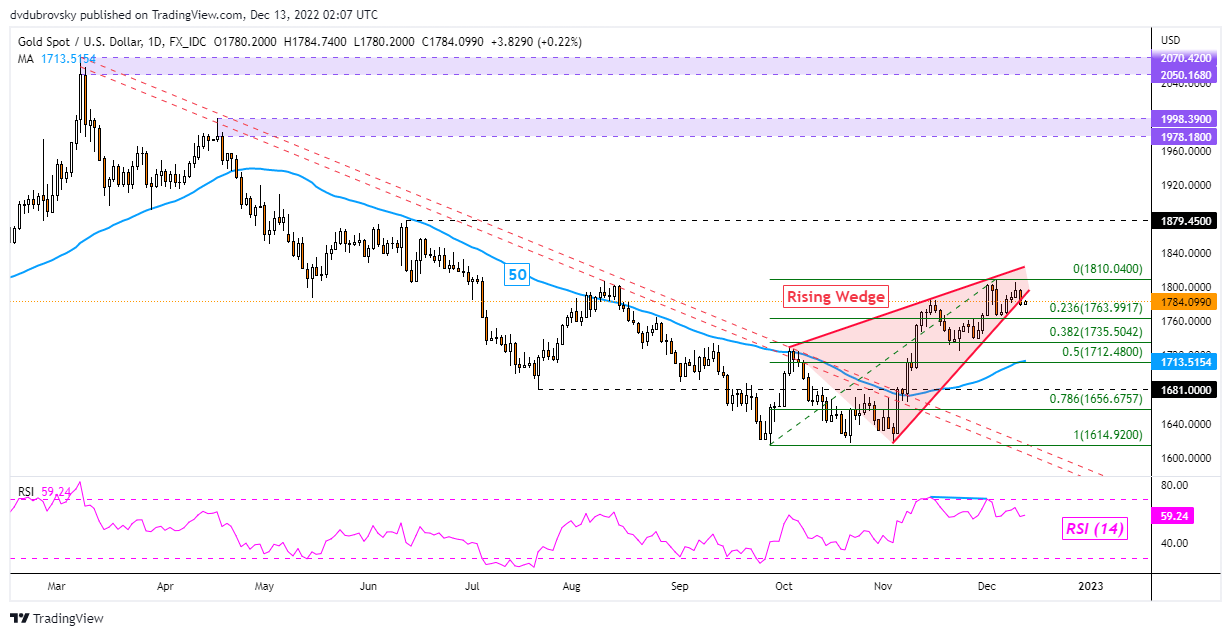
Chart Created Using TradingView
— Written by Daniel Dubrovsky, Senior Strategist for DailyFX.com
To contact Daniel, follow him on Twitter:@ddubrovskyFX