
Bitcoin, Ethereum Talking Points
Recommended by Tammy Da Costa
Get Your Free Bitcoin Forecast
Bitcoin Challenges Six-Month Highs, Ignoring Risks of Higher Rates
Bitcoin prices have risen to their highest levels in six months, increasing the potential for the major cryptocurrency to retest $25,000.
Despite the elevated fundamental risks, major cryptocurrency have remained resilient, ignoring the risks of higher rates and a hot PPI (producer price inflation) print.
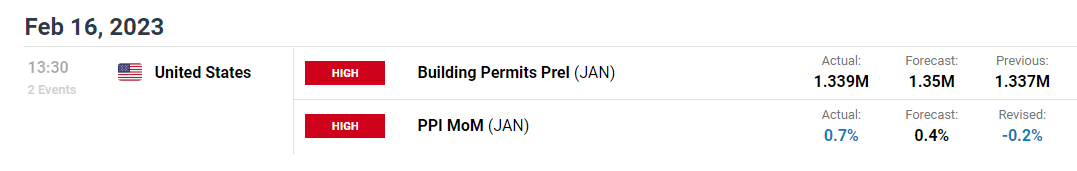
For all market-moving events and data releases, see the real-time DailyFX Economic Calendar
While Fed officials continue to confirm the need for more aggressive measures to tame persistently high inflation, market participants have favored speculative assets, lifting BTC back toward $25,000.
With the current daily high holding around $24,895, the 13% rally from Monday’s open ($21,376) has allowed BTC/USD to rise above the January high, now providing support at $23,954.
As crypto enthusiasts aim to reignite the uptrend responsible for driving BTC to an all-time high of $69,000 (in November 2021), the surge in bullish momentum has pushed the RSI (relative strength index) to the boarder of overbought territory.
While price action currently remains above both the 50 and 200-day MA (moving average), a potential shooting star formation provides additional caution for the short-term move. In technical analysis, the candlestick pattern occurs at the end of a strong uptrend and is considered to be bearish in nature.
Bitcoin (BTC) Daily Chart
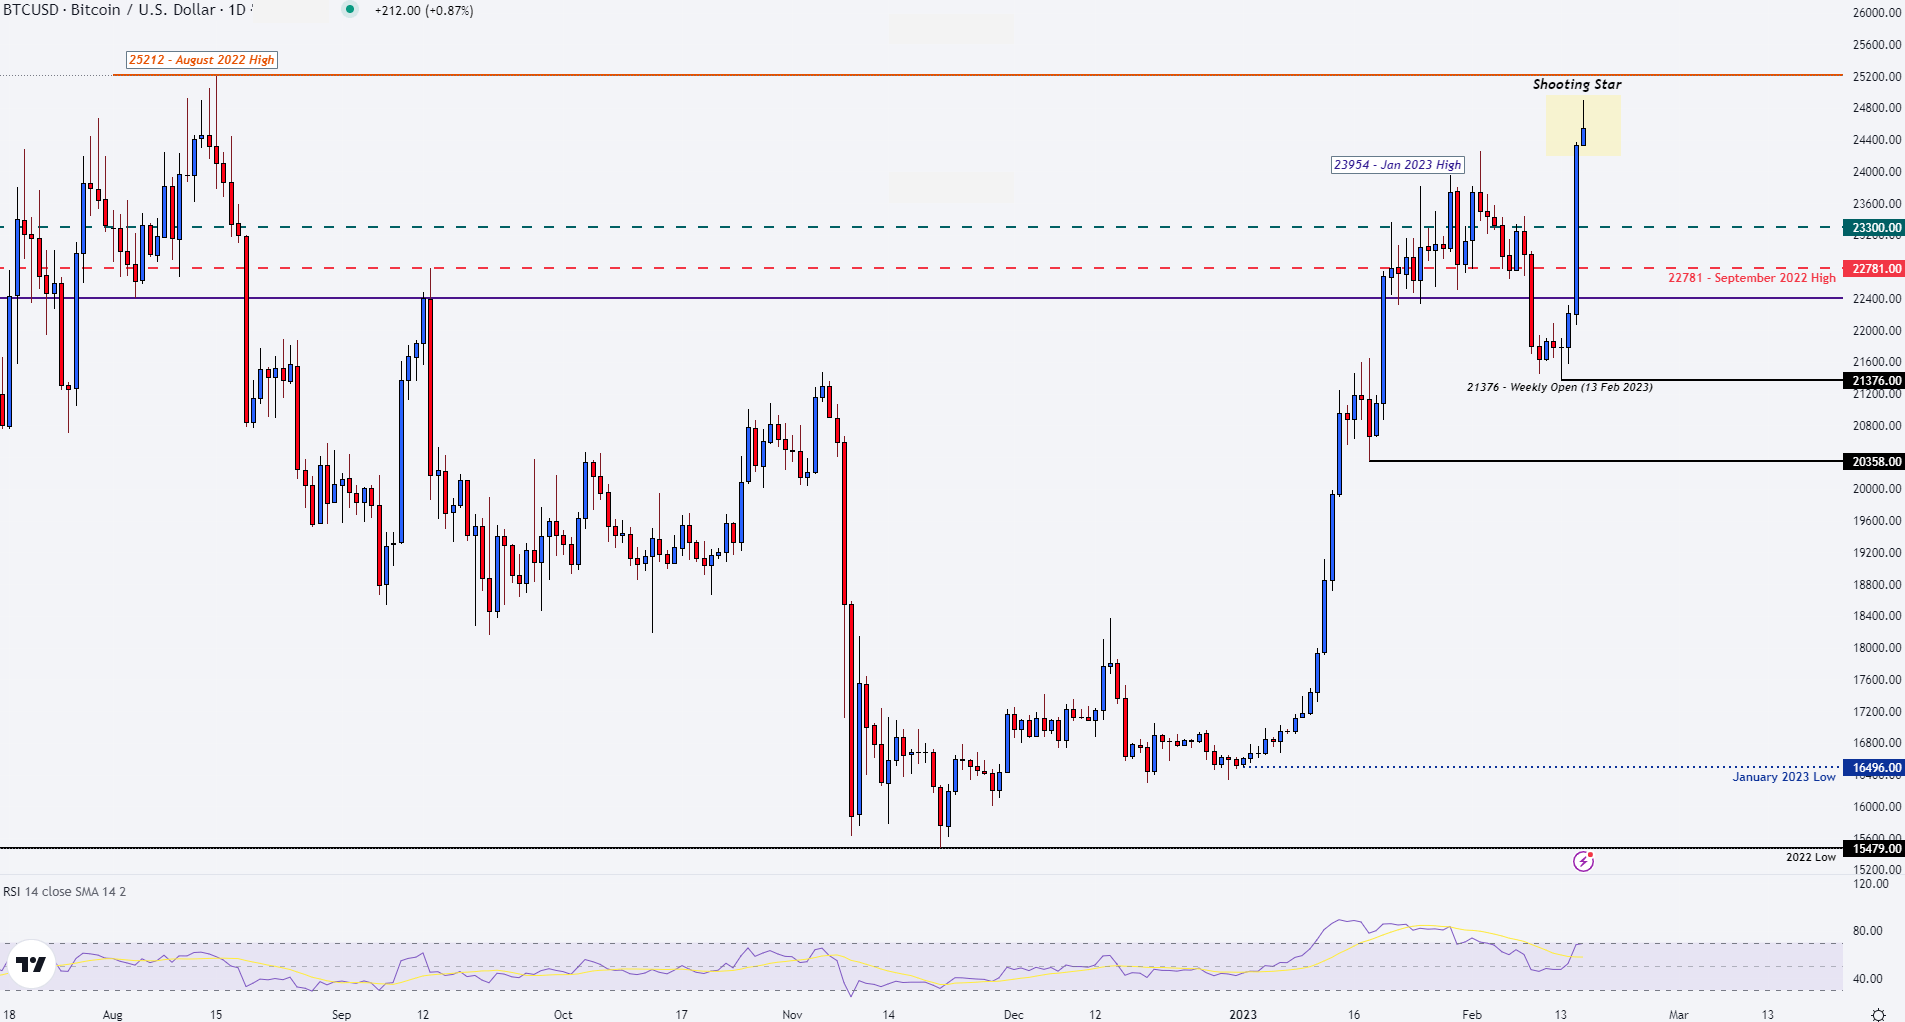
Chart prepared by Tammy Da Costa using TradingView
After rising to a high $24,895 earlier today, a rejection of the upper wick at resistance drove prices back below $24,500. As a result, a low-bodied has formed at the bottom of the wick, suggestive of indecision.
Recommended by Tammy Da Costa
The Fundamentals of Breakout Trading
For BTC/USD to break higher, bulls will need to clear a few technical hurdles. The first big challenge will be for buyers to drive prices above $25,000 and return to the August high of $25,212. Above that, is the May 2022 low at $25,401 which leaves the door open for the 61.8% Fibonacci retracement of the 2020 – 2021 move at $28,737.
Bitcoin (BTC/USD) Key Levels
| Support | Resistance |
|---|---|
| 23,954 (Jan high) | 25,000 (Psychological level) |
| 22,871 (September 2022 High) | 25,212 (August 2022 high) |
| 21,376 (13 Feb open) | 25,401 (May 2022 low) |
Ethereum (ETH) Price Action
Much like its major counterpart, Ethereum prices have failed to gain traction, pushing prices below $1,700. After a brief retest of $1,712, failure to drive momentum above the current month high of $1,714 (2 Feb) placed pressure on price action, forcing prices lower.
As ETH/USD returned to the November high around $1,6788, a single line on the daily chart and the lack of a candlestick body has highlighted the resilience of this zone.
With the 61.8% retracement of the August – November move holding as support at $1,664.82, a move lower could assist in driving price action toward psychological support at $1,600.
Ethereum (ETH) Daily Chart
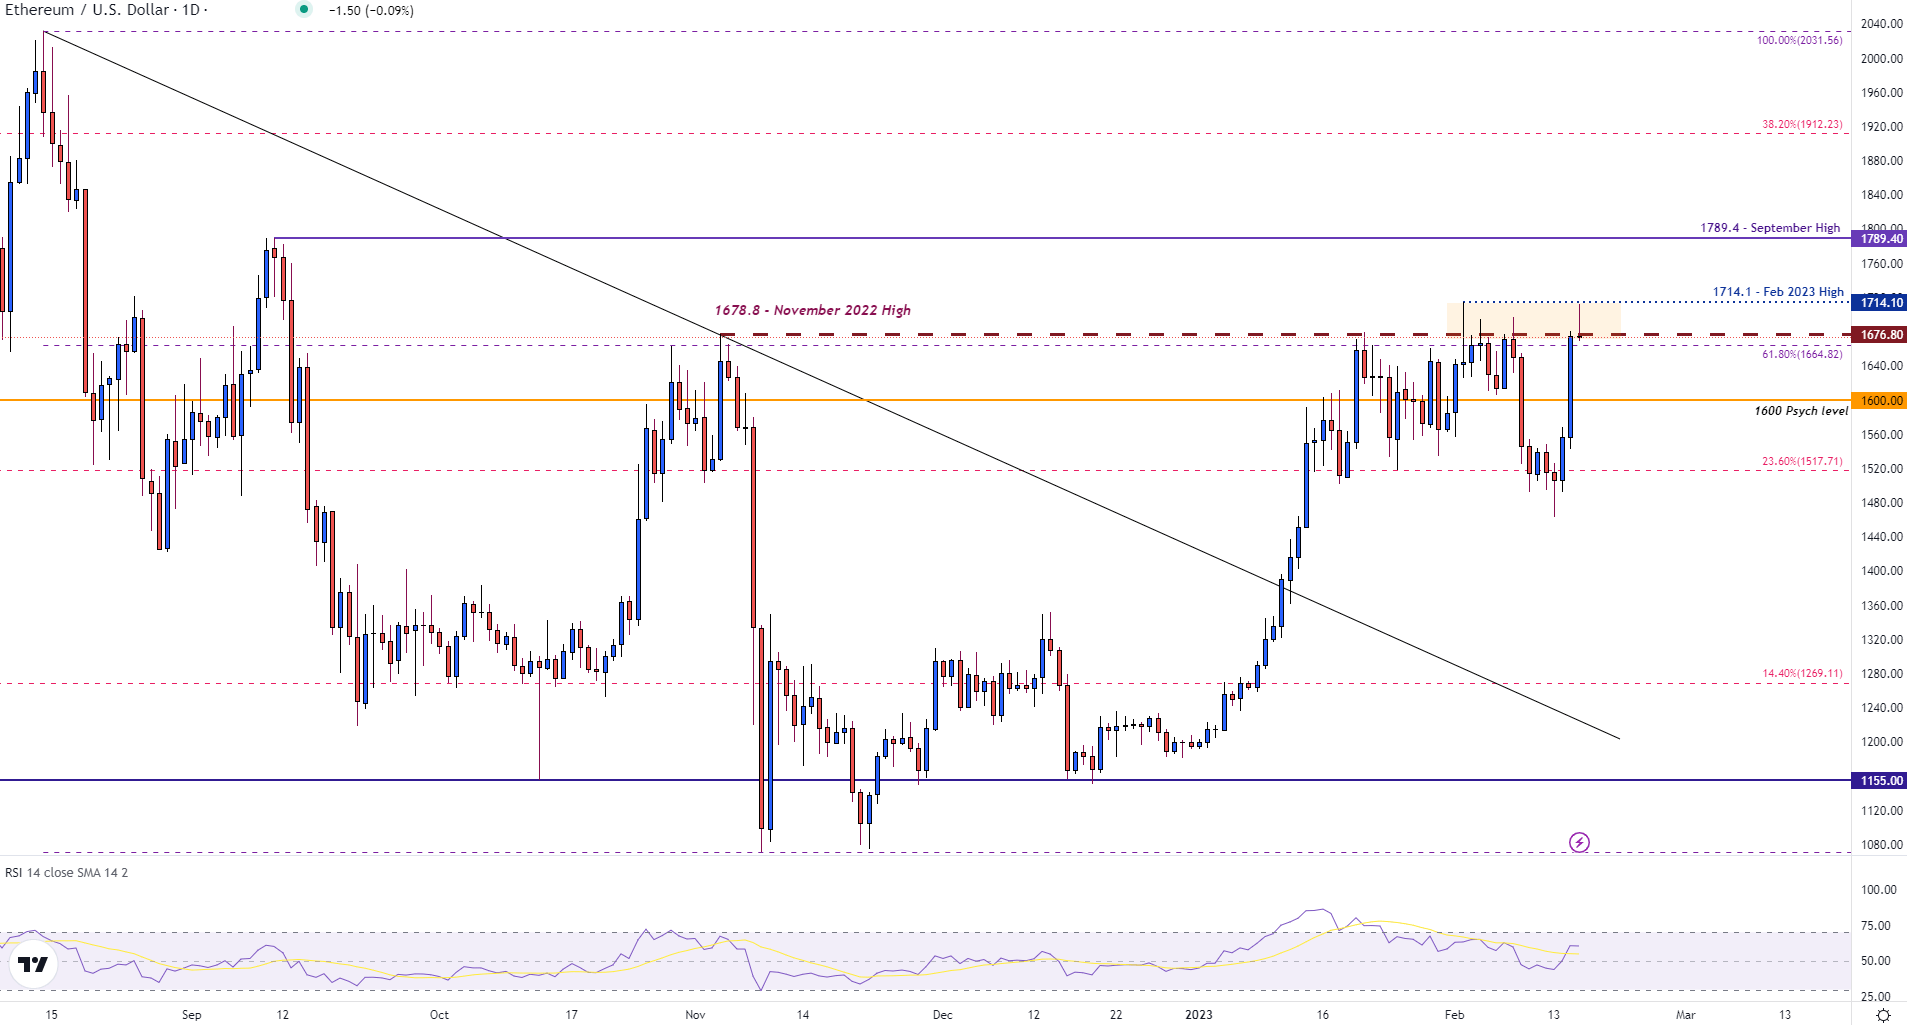
Chart prepared by Tammy Da Costa using TradingView
Ethereum (ETH/USD) Key Levels
| Support | Resistance |
|---|---|
| 1,664.82 (61.8% Fibonacci retracement) | 1,676.8 (November high) |
| 1,600 (Psych level) | 1,700 (Psych level) |
| 1,517 (23.6% retracement of the 2022 move) | 1,714 (2 Feb high) |
Bitcoin Further Reading:
Trade Smarter – Sign up for the DailyFX Newsletter
Receive timely and compelling market commentary from the DailyFX team
Subscribe to Newsletter
— Written by Tammy Da Costa, Analyst for DailyFX.com
Contact and follow Tammy on Twitter: @Tams707