Indices Talking Points:
- There’s one trading day left in 2022 after today’s session, and it’s time to start looking into 2023 market themes.
- The S&P 500 set its current all-time-high on the second trading day of 2022 and it was a bearish outing since, with a net move of about -20% in S&P 500 futures. But there were multiple twists and turns along the way.
- The analysis contained in article relies on price action and chart formations. To learn more about price action or chart patterns, check out our DailyFX Education section.
Recommended by James Stanley
Get Your Free Equities Forecast
The door is almost closed on 2022 and it was a bad year for stocks, which has been an usual statement to make ever since global central banks embraced QE in the post-Financial Collapse backdrop. The S&P 500 topped on the second trading day of the New Year and it was a pensive ride-lower for the rest of 2022. But, it wasn’t a linear move; there were multiple rallies along the way, with a +12% bump in Q1 followed by an +18.92% rally in June, set just after the FOMC rate decision that saw the bank force their first 75 bp hike in 40 years.
S&P 500 Daily Chart
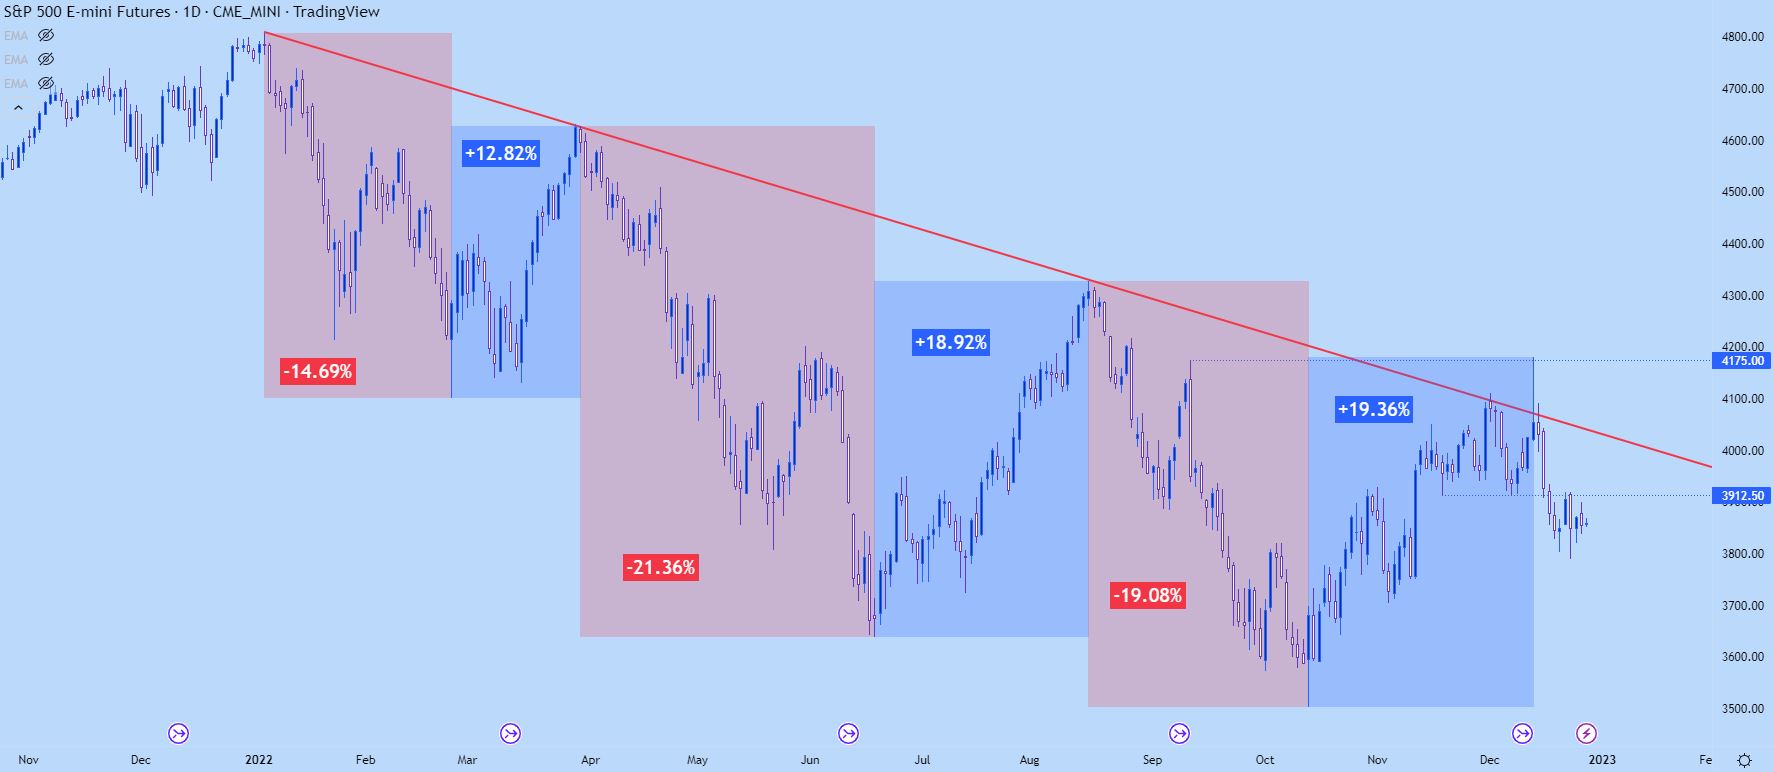
That rally pushed into August trade at which point Jerome Powell went out of his way to illustrate a very hawkish message from the FOMC at the Jackson Hole Economic Symposium, and that triggered another bearish run that ran into October. But, again, after briefly pushing down to fresh lows a counter-trend response showed, and stocks rallied by as much as 19.36% over the next two months until eventually running into a trendline projection that held the highs in the S&P 500 all year.
With the tug-of-war that’s shown in price action and, in-turn, sentiment, even despite the net move of almost -20% from this year’s high to current price (as of this writing), the ‘buy the dip’ mentality still persists in equity markets. Some are even expecting the Fed to pivot into rate cuts at some point next year, even with inflation holding above 7% (via CPI). Inflation remains far-elevated beyond the Fed’s targets and while some warning signs have started to show, such as with housing, the Fed still has work to do to get inflation to more-palatable levels.
Meanwhile, in Europe and the UK, inflation is over 10% and those Central Banks have their work cut out as there’s even less growth in their economies than in the US. They’re both facing the undesirable scenario of having to hike into a recession, which then puts even more pressure on corporates as they now have to deal with strained consumers on top of more-difficult operating conditions.
I’m bearish on equities going into next year and I don’t think the Fed is near a pivot yet. The situation that they absolutely want to avoid is high inflation in a recessionary environment because this removes much of the flexibility from the Central Bank in being able to re-stimulate the economy. In the coming months, we’ll likely start to see the ramifications of 2022’s rate hikes playing out. This will probably impact corporate earnings more intensely as we wade into next year.
Below, I parse through three of the top equity themes for next year.
Recommended by James Stanley
Get Your Free Top Trading Opportunities Forecast
Theme One: The Fed Pivot
There’s already been a lot written about this and we’ve even heard directly from the Central Bank: No pivot is planned. But, again, it’s worth defining a pivot because in reality a pivot can be used to describe any change, if we’re being technical about it. Kind of like transitory, right? Well, a pivot into a less-hawkish stance seems logical. Frankly the Fed took a historic route with rate hikes this year and it’s difficult to imagine that continuing through next year.
But, what about a pivot into rate cuts? Or QE or just softer policy, in general? After all, this has been cure to equity bulls’ pain for more than a decade now, ever since the Financial Collapse when Central Banks figured out that they can artificially peg rates lower by embarking on bond buying programs. All is well so long as the music continues to play but as soon as inflation begins to rise, the horizon begins to shift and that’s where we’re at now.
It seems unlikely that we’ll see a pivot into a dovish position from the Fed, looking at rate cuts, unless some pretty significant destruction happens. To be clear, holding rates at a restrictive level can help inflation to come down. This is similar to what happened in the early-80’s. The difference, however, is that rates aren’t nearly as high as they were then and questions remain as to whether rates at that level would even be possible today with the US debt-to-equity ratio, which is much higher than it was 40 years ago when Volcker made his move.
Another key point – can the US economy maintain with that more restrictive backdrop without something breaking? Black swans are notoriously unpredictable, but increasing the velocity in the backdrop with higher rates and tighter operating conditions can increase the probability of something going awry, such as we saw in the crypto space through last year. For bulls looking for a pivot into actual rate cuts and softer policy, ‘something’ breaking may ironically be the fastest way to get there.
The index that I’m watching for that next year is the Nasdaq and there could be a case to be made for the Russell 2000, as well.
In the Nasdaq, price is already testing a massive zone with longer-term consequence. The area that runs from 10,501-10,751 was a target from my Q4 Top Trades installment and that came into play a couple of weeks into the fourth quarter. The topside of the zone came into play in early-November and helped to hold the lows again. By the end of the year, it was back in the equation again, helping to set the low yesterday.
A breach of that opens the door to the next zone of longer-term support that runs from the pre-pandemic swing-high of 9763 up to the 10,000 level that’s confluent with a Fibonacci retracement. If we do end up with that ‘destructive’ framework, however, the low could be much lower than that.
Recommended by James Stanley
Top Trading Lessons
Nasdaq Weekly Price Chart
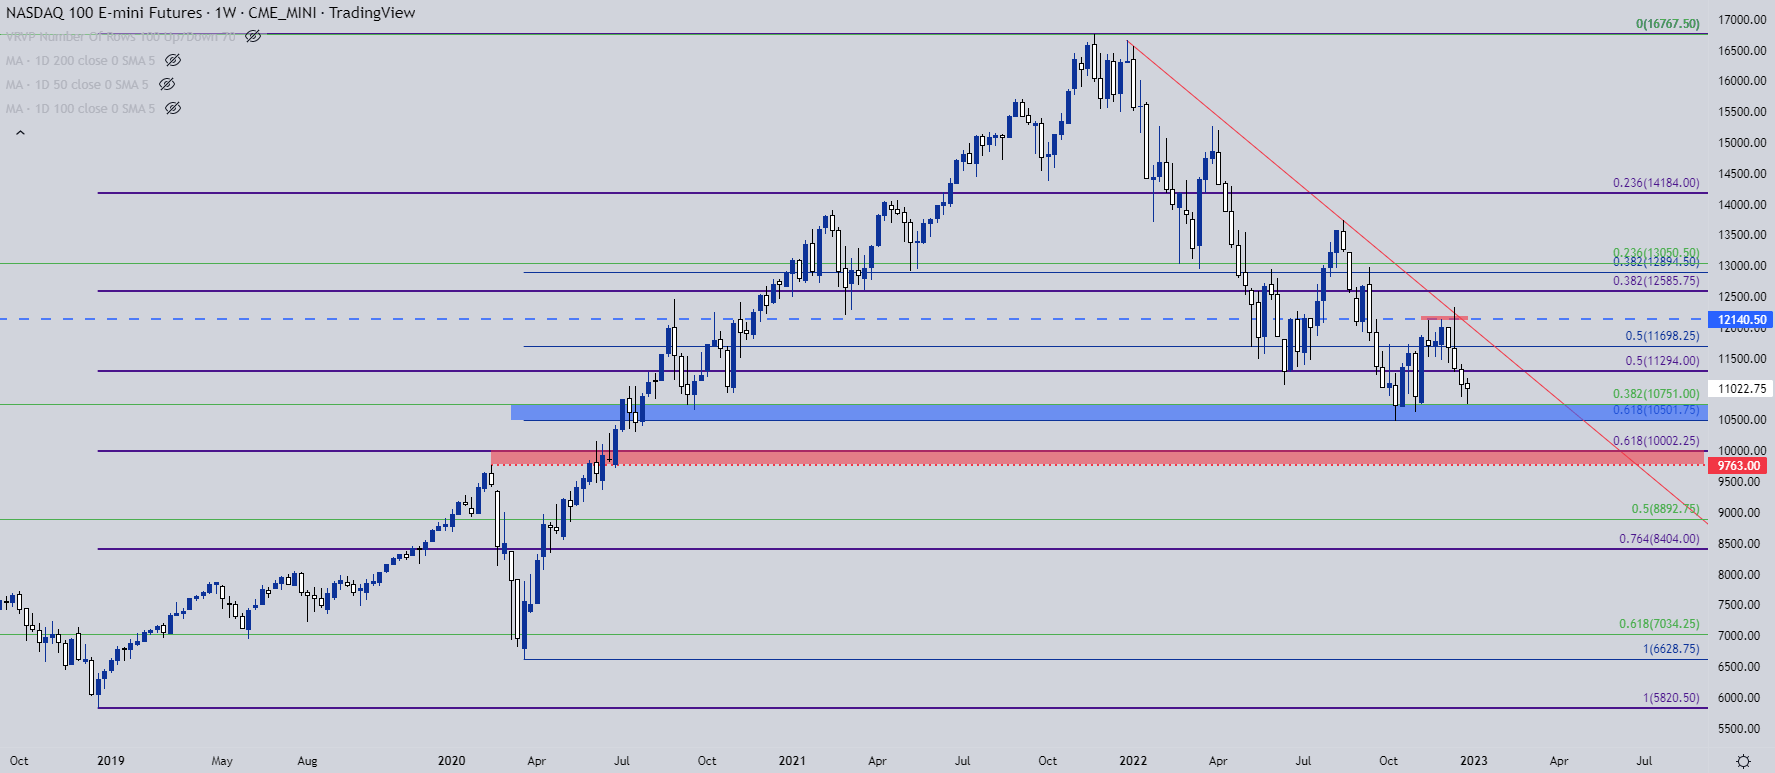
Chart prepared by James Stanley; Nasdaq 100 on Tradingview
Theme Two: Markets De-Fanged
FANG was all the rage when equity markets were bubbling higher with pandemic stimulus. But, that theme started to unwind last year with some major destruction showing in a couple of those names.
One of the reasons that these companies were so attractive in the pandemic backdrop was the potential. With a tech leader like Amazon or Apple, they already have strong market share so if macro growth expectations are there, these companies should benefit; and in some cases, massively so. And naturally when markets are running-higher there’s some intense interest behind these names. But, as the backdrop shifts so does sentiment and this had led to less of a haircut and more of a decapitation in Facebook (now Meta) and Netflix.
The big question here for next year is whether something similar to March of 2020 plays out. That is, markets start to get excited about these tech titans again, driven by the prospect of an oncoming wave of growth. Something like this would likely need to be matched with a Fed pivot into a softer, more dovish policy. So it feels weird to say but, is there a point next year where these companies might actually get treated similar to value plays? In essence, offering markets the opportunity to buy growth at a lower premium?
In Amazon, prices have already tested that March 2020 low. There’s also a trendline projection in here, although its just two points of confirmed touch at this point. The next support zone below is just above the 60-handle.
Amazon Monthly Price Chart
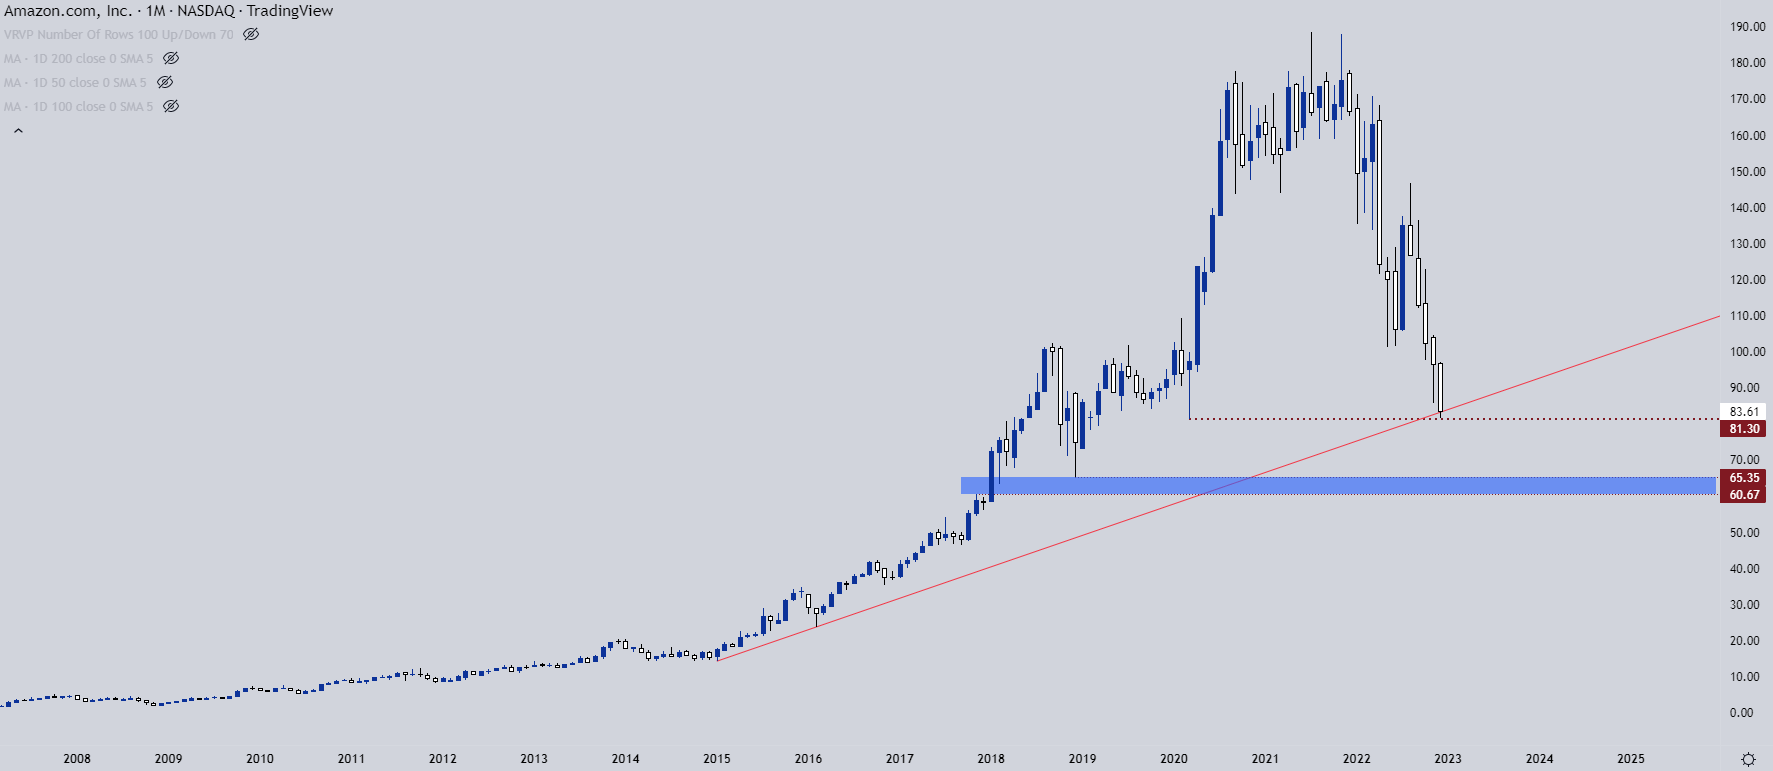
Chart prepared by James Stanley; AMZN on Tradingview
Apple is a personal favorite of mine and it’s a stock that I’m tracking for a similar purpose, essentially trying to buy long-term growth at a lower multiple.
The stock is off -29% this year and holding at a key spot of support at the 126.62 spot on the chart, which is the 38.2% Fibonacci retracement of the 2018-2022 major move. Perhaps fittingly, that cycle started at the end of the Fed’s last hiking cycle. Below that 38.2 retracement is the 50% marker just below the 110 handle, after which the 61.8% retracement shows at 91.82. A show of support at either could make for an argument for longer-term accumulation scenarios.
Recommended by James Stanley
Traits of Successful Traders
Apple Weekly Price Chart
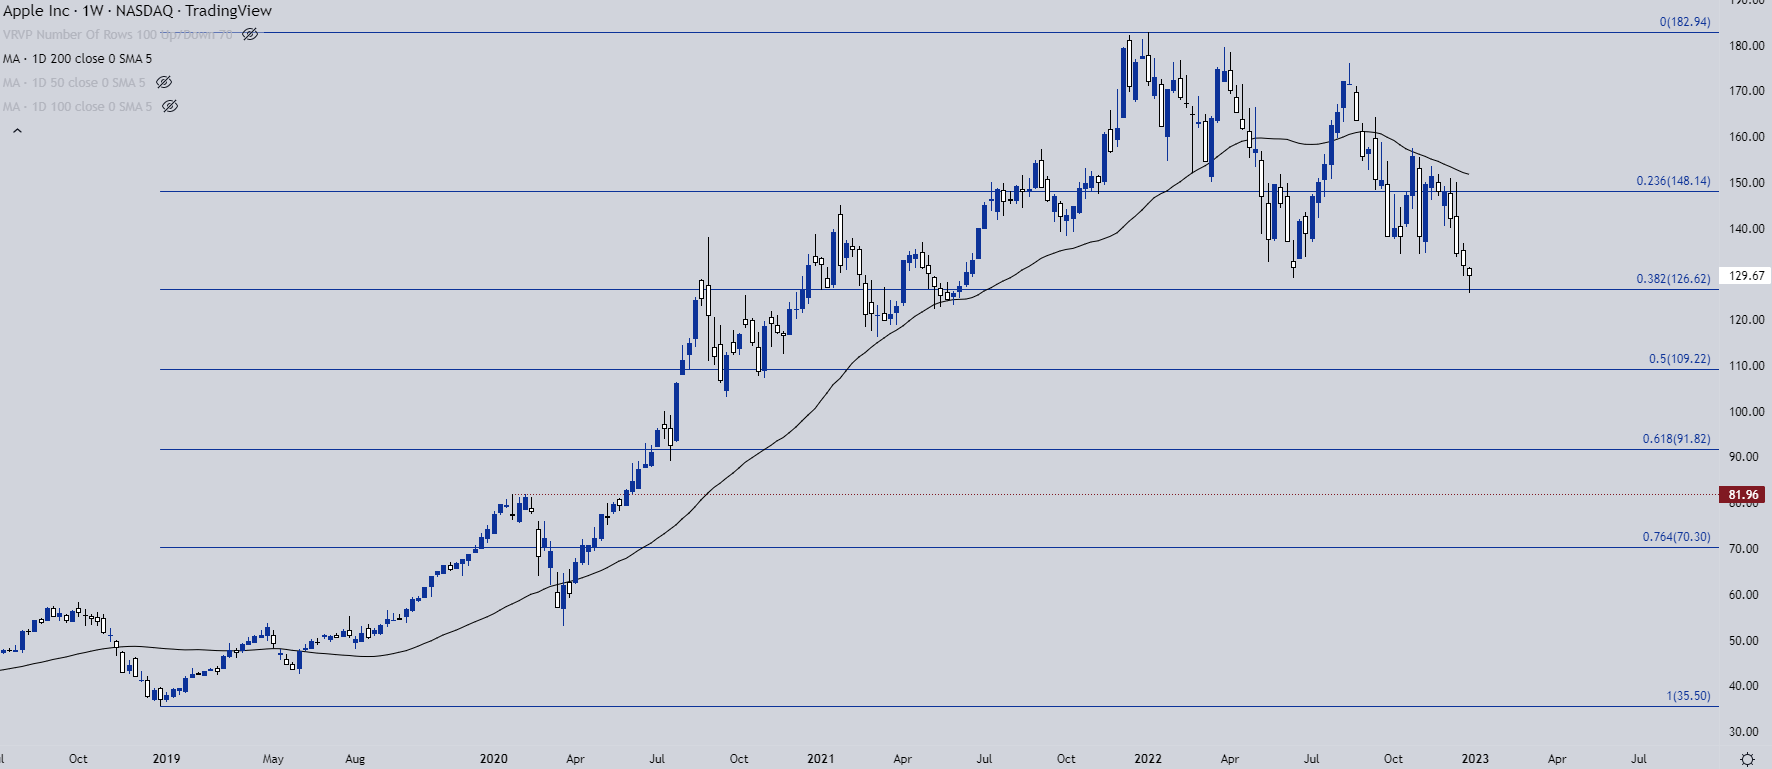
Chart prepared by James Stanley; AAPL on Tradingview
Facebook/Meta
Facebook sure picked a terrible time for a pivot. A business pivot, that is, not a Fed pivot. The company is still adjusting after a tectonic change to privacy restrictions was set in motion by Apple. Where Facebook was an advertising leader before, largely due to the granularity of data that they were able to draw from its users, the company re-branded as ‘Meta’ in effort of focusing more heavily on Virtual Reality and the Metaverse.
I’m in the exception in that I think virtual reality has a future. But, like many others, I question Facebook, or Meta’s role in that future. This pivot really seemed a move of necessity after Facebook’s golden goose got cooked by Apple’s privacy restrictions. I’m not a fan of the stock from a fundamental basis. But, there is a price that’s interesting for support a little lower on the chart. This is the 2014 high at $72.59 that came in as support in August of 2015. A hold at that level opens the door for a bounce play. Whether that turns into a legitimate bottom or not will remain to be seen.
Facebook/Meta Monthly Price Chart
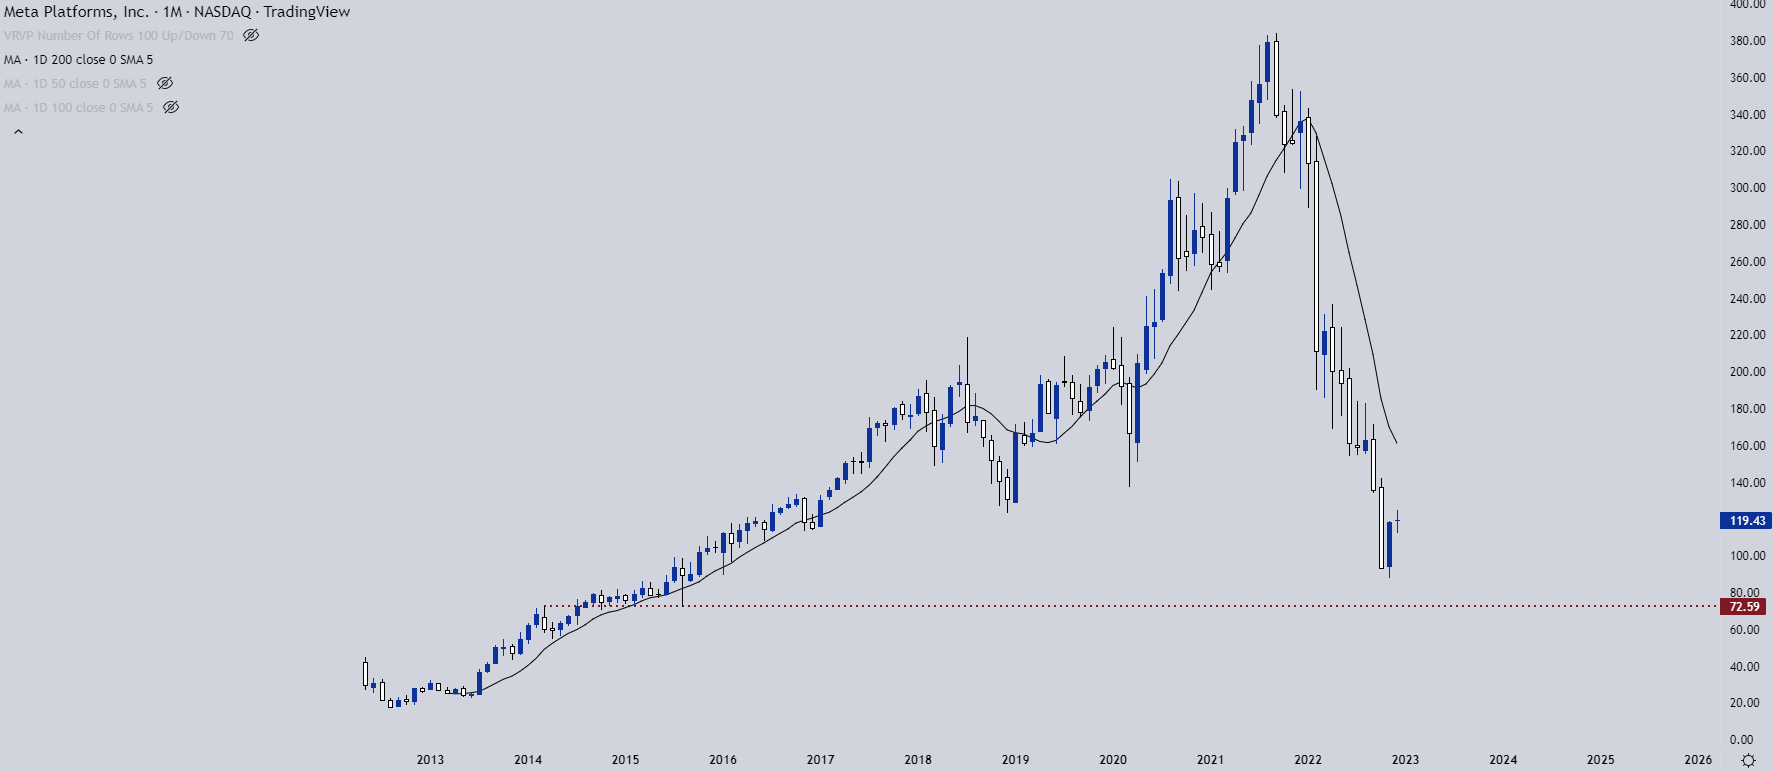
Chart prepared by James Stanley; FB/Meta on Tradingview
Netflix
Netflix is another company that I’m not a fan of from a fundamental point of view. When rates are low and cash is cheap, investing in an IP portfolio makes sense. But, as rates go up and consumers are faced with more-difficult purchasing decisions, the value of that portfolio becomes really important.
And at this point Netflix has some pretty stiff competition from the likes of Disney and Warner Brothers (owners of HBO Max). The growth rates that markets celebrated are going to be much more difficult to meet in a slower business environment and now they’re facing even more competition.
The stock has been crushed so far in 2022, falling by as much as -76% from its 2021 swing high. It’s rallied by 80% from the June lows, however, and at one point that move was over 100%. Current resistance has played-in from a prior swing-low, plotted at 329.82.
If equity markets do go into a bearish trend in early-2023 trade, NFLX presents a compelling setup.
Recommended by James Stanley
How to Trade FX with Your Stock Trading Strategy
Netflix Weekly Chart
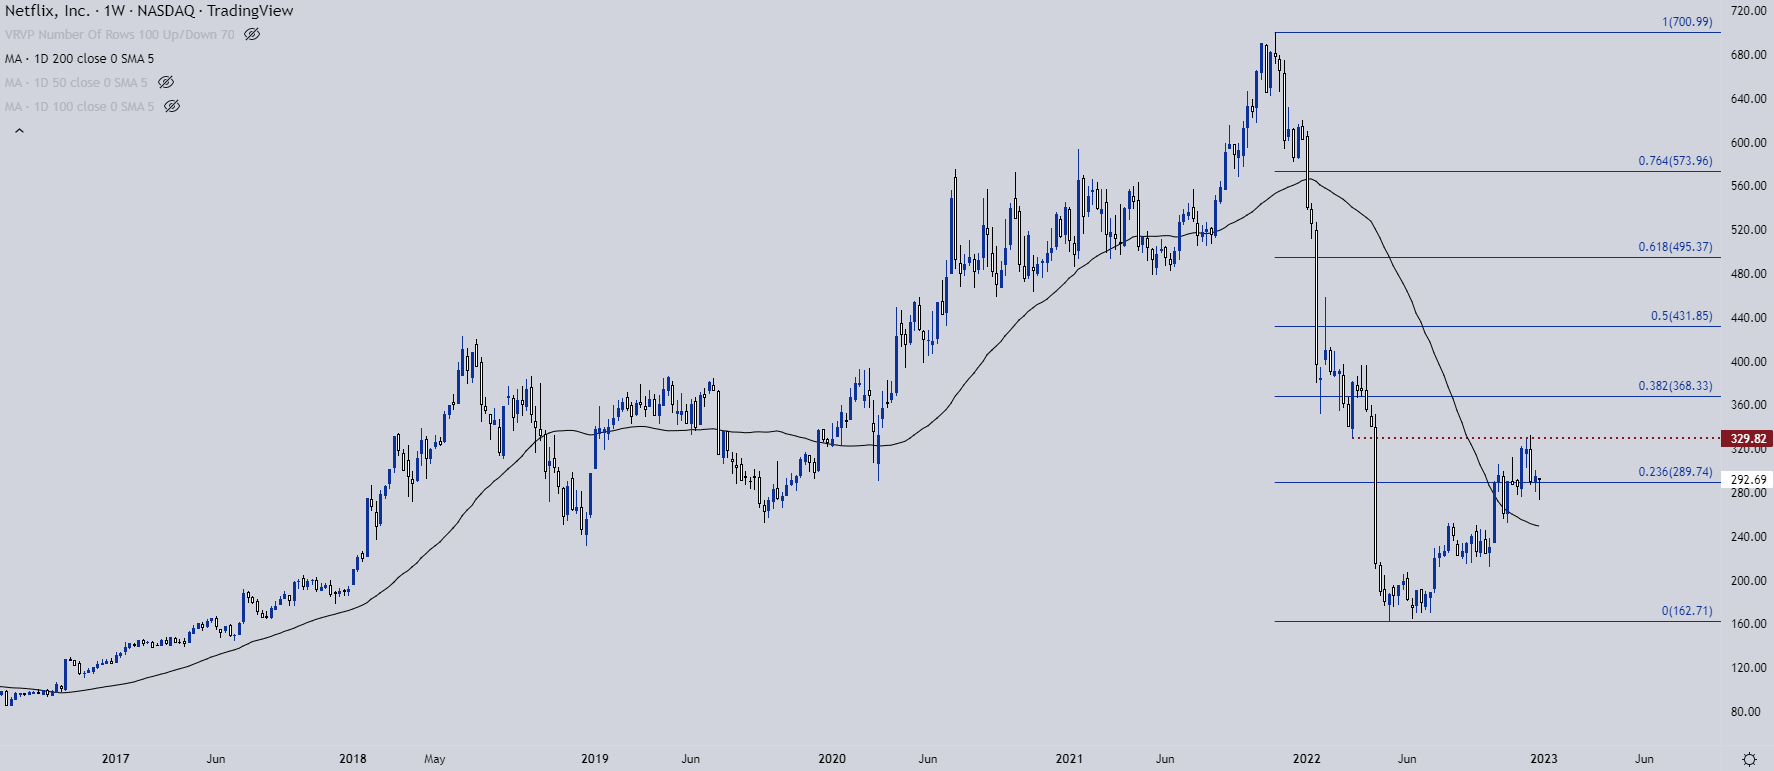
Chart prepared by James Stanley; FB/Meta on Tradingview
Google has changed the world, and the stock reflects that, jumping by more than 500% from the low in 2015 up to the 2021 high.
But, after setting a double top formation in November and then February of this year, the stock has given back as much as 50% of that major move. The next spot of support is at the 61.8% Fibonacci retracement which syncs with the pre-pandemic swing-high. And then a bit-lower, there’s some pretty substantial support around the 55 handle, as this is a Fibonacci retracement that’s confluent with the March 2020 swing lows.
Google Monthly Price Chart
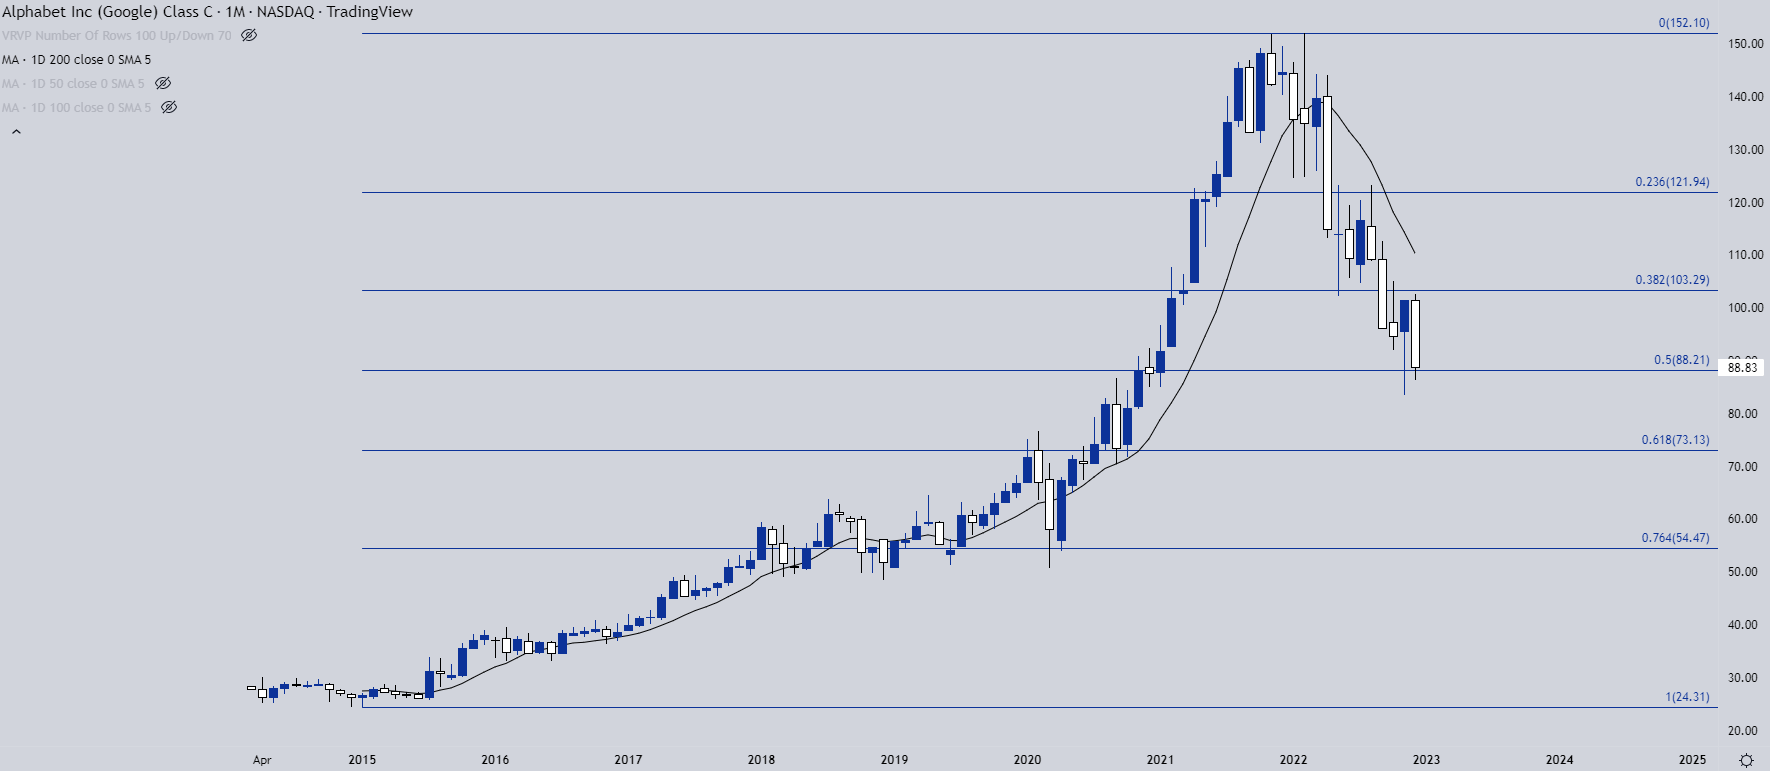
Chart prepared by James Stanley; GOOG on Tradingview
Theme 3: Does Elon Step Down from Twitter?
A major market saga from 2022 was Elon Musk’s acquisition of Twitter. While it looked dead in the water for much of the year, the deal was forced and he took over the social media service in the latter-portion of the year.
The acquisition required the sale of some Tesla shares so naturally the market dropped on that fact; but it was the follow-through to the sell-off that’s really started to get attention. Tesla has been a darling stock of equity markets for years, carrying a massive multiple that made it look like anything but a car manufacturer.
The stock has been punished, falling to a split-adjusted two-year-low.
The big question in my mind is how the stock reacts if/when Elon Musk announced that he’s stepping down from the CEO role at Twitter to focus on Tesla. Shorts will likely get squeezed aggressively here and if we are nearing a backdrop that’s attractive for equity accumulation again, the bull case for Tesla could brighten significantly. This is probably linked with larger macro themes and as always the question is timing; but this was once a darling stock that retains many of the same fundamental arguments that were pushing the bullish trend in 2021.
For next supports, the pre-pandemic swing-high is all the way down around the $65 handle.
Tesla Weekly Price Chart
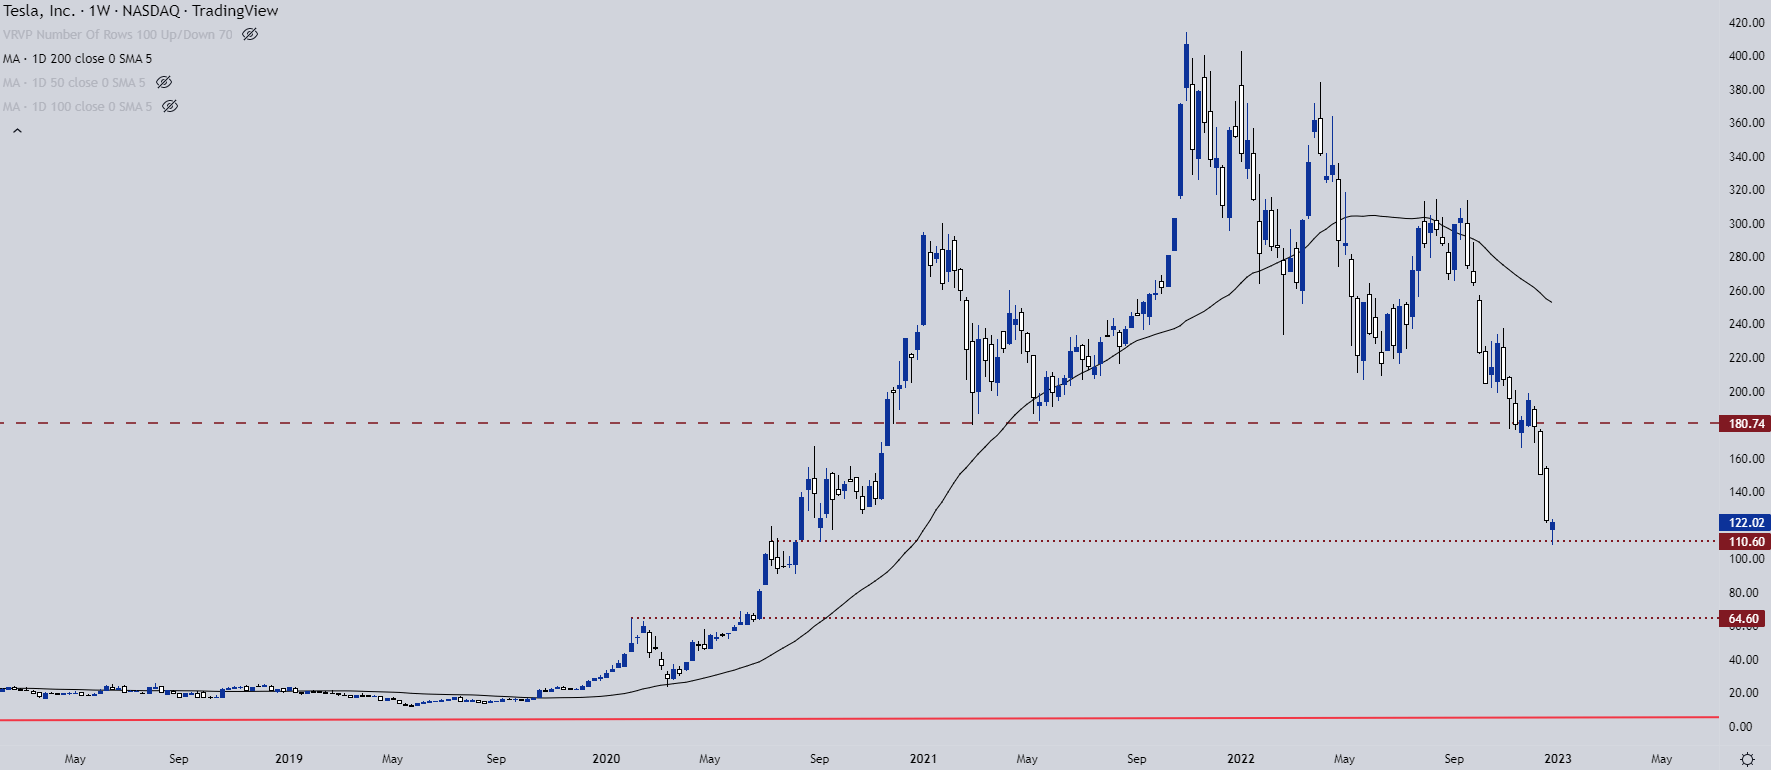
Chart prepared by James Stanley; Tesla on Tradingview
— Written by James Stanley
Contact and follow James on Twitter: @JStanleyFX