
Crude Oil, WTI, Powell, DOE, JOLTs Jobs Openings – Talking Points:
- Crude oil sinks the most in 2 months after Powell’s testimony
- WTI is eyeing DOE oil inventory data and JOLTS job openings
- Bearish Rectangle in focus, IGCS offering bearish perspective
Recommended by Daniel Dubrovsky
Get Your Free Oil Forecast
WTI crude oil prices sank 4.08% on Tuesday, marking the worst single-day performance in 2 months. As was the case with most financial assets over the past 24 hours, oil was closely tracking the market reaction to testimony from Federal Reserve Chair Jerome Powell before the Senate Banking Committee.
Long story short, Mr. Powell offered an increasingly hawkish outlook and markets began pricing in a 50-basis point rate hike as the base scenario for this month’s policy announcement. With 14 days to go, the CME FedWatch Tool is showing an almost 75% probability of a 50-bps rate hike in March.
Oil prices can be quite sensitive to interest rate expectations. After all, higher interest rates would serve to slow down the economy to combat high inflation. If that opens the door to slower growth, then that could translate into less demand for WTI.
Focusing on the remaining 24 hours, oil prices are eyeing 2 key event risks. The first is weekly DOE oil inventories. Supply is seen rising by 0.119 million barrels. The second item will be JOLTS job openings data. The latter will offer further insight into the state of the labor market amid the data-dependent Fed.
Crude Oil Technical Analysis – Daily Chart
On the daily chart, WTI seems to be trading within the boundaries of a Bearish Rectangle chart formation. The floor seems to be around 72.27 with the ceiling around 82.13. While prices remain within this pattern, the near-term technical picture may remain neutral. But, a downside breakout opens the door to an increasingly bearish outlook.
Recommended by Daniel Dubrovsky
How to Trade Oil
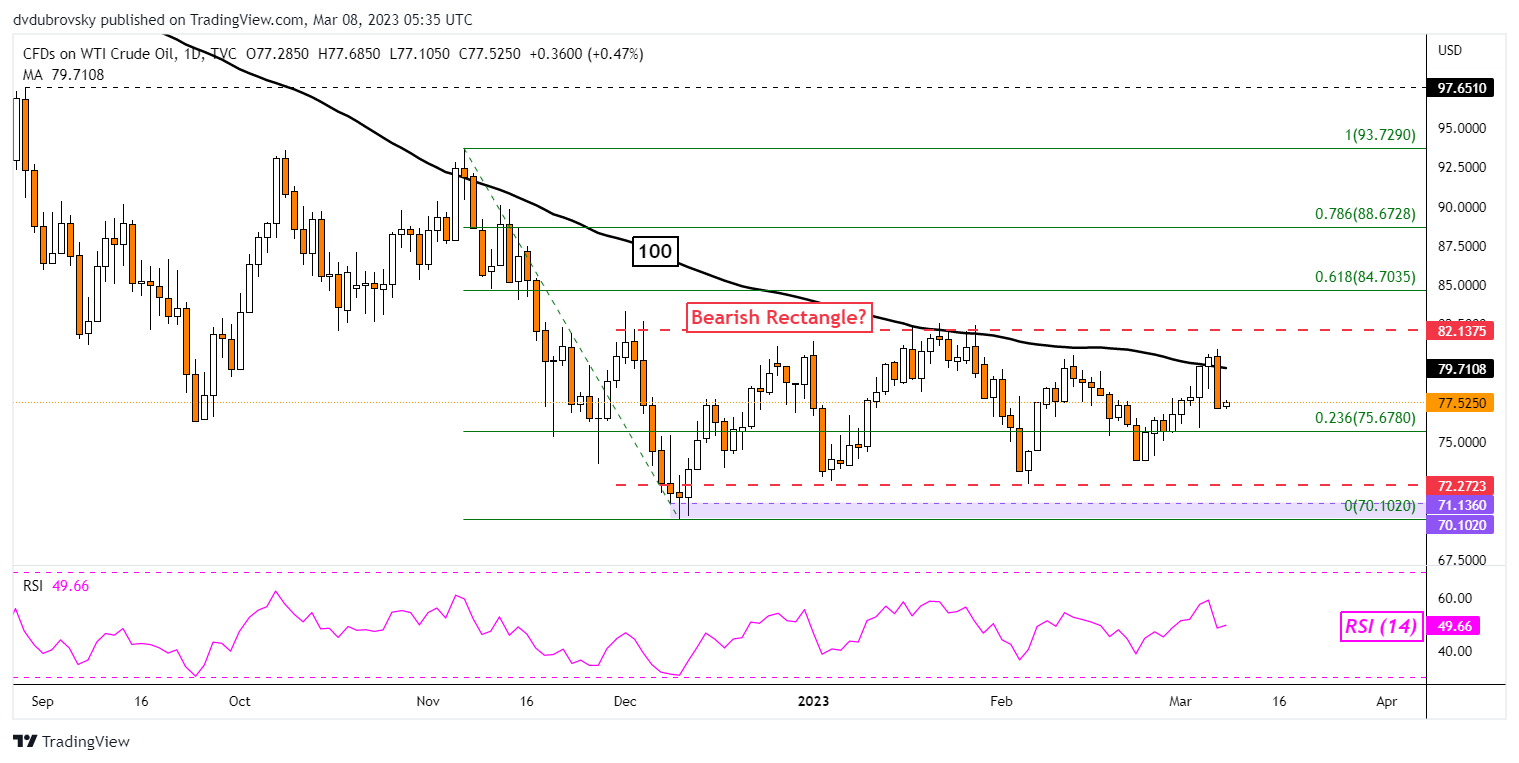
Chart Created Using TradingView
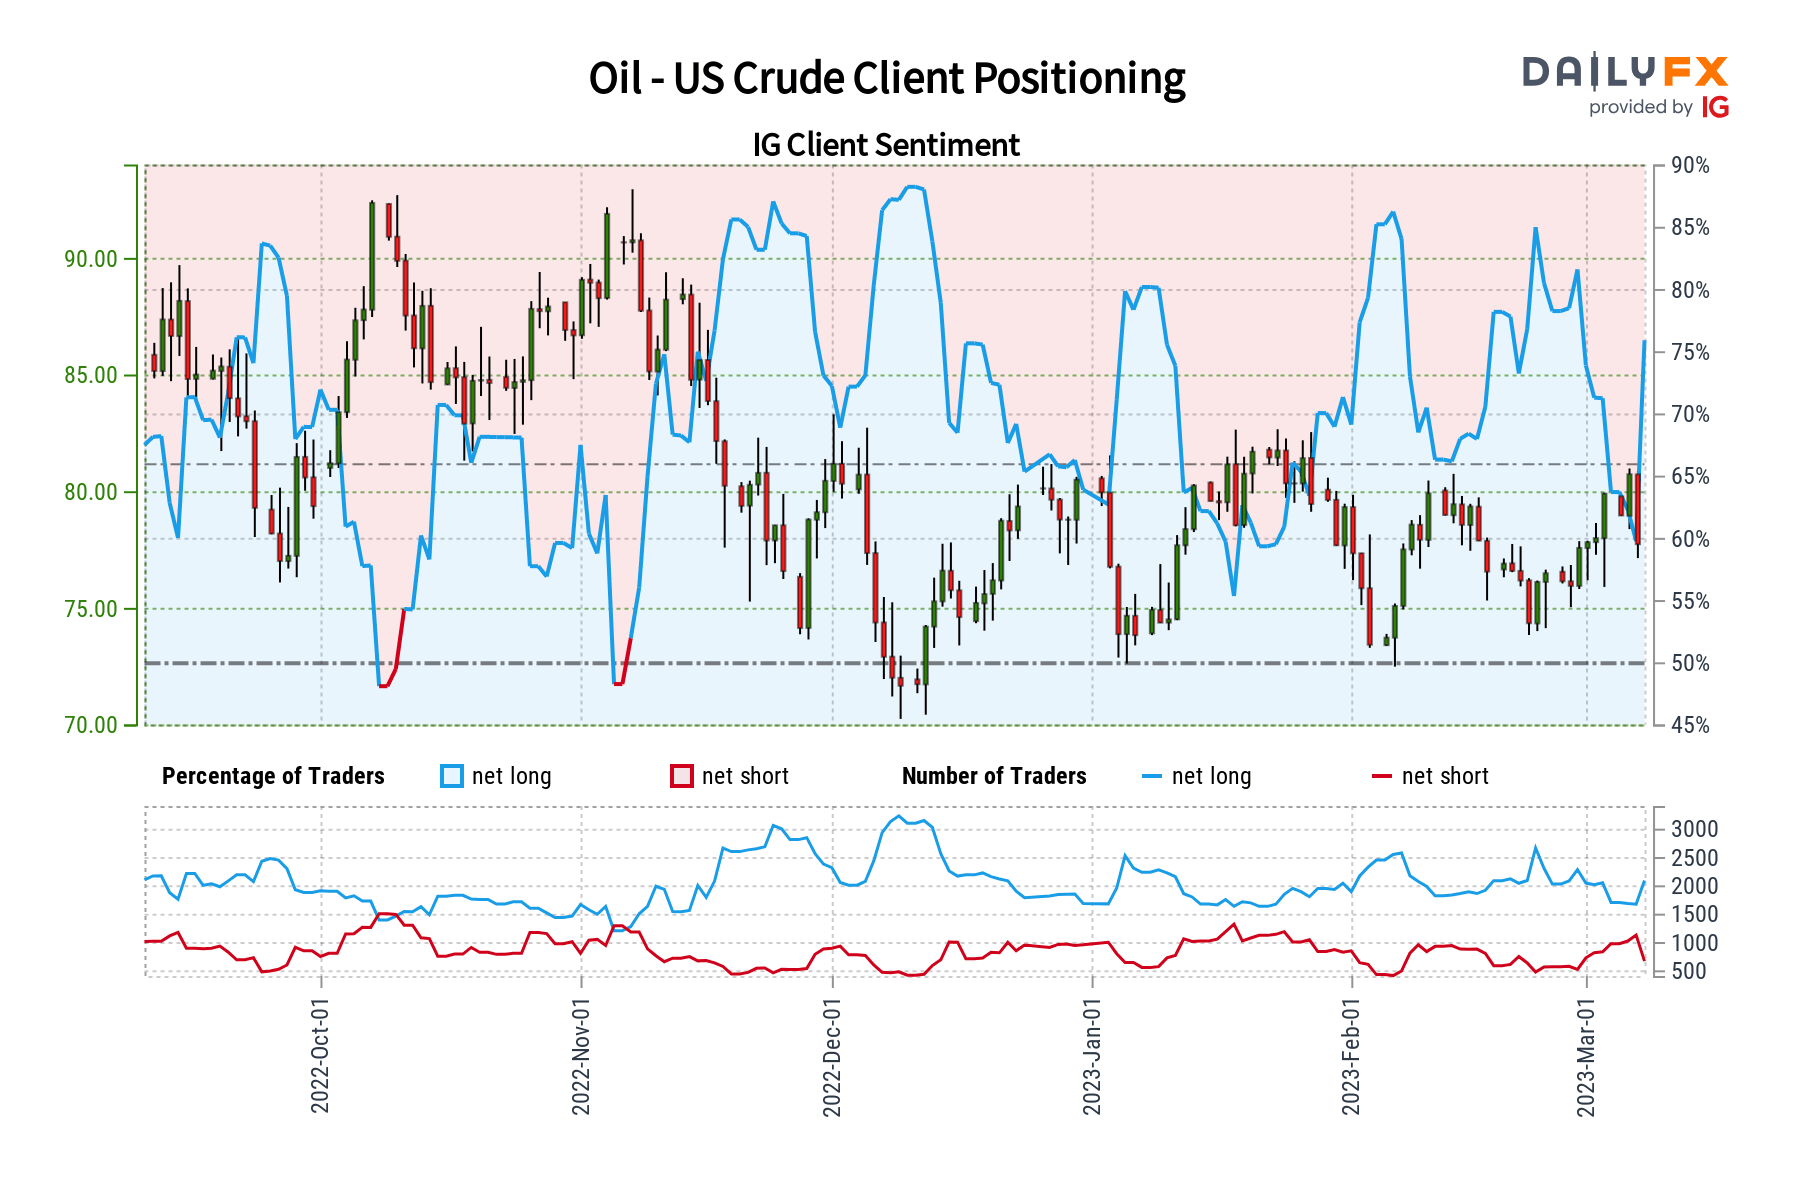
Crude Oil Sentiment Analysis – Bearish
Looking at IG Client Sentiment (IGCS), which is a contrarian indicator, about 77% of retail traders are net-long crude oil. Since most traders are net-long, this hints price may continue falling. This is as upside exposure increased by 26.08% and 2.33% compared to yesterday and last week, respectively. With that in mind, these figures seem to offer a stronger bearish contrarian trading bias.
— Written by Daniel Dubrovsky, Senior Strategist for DailyFX.com
To contact Daniel, follow him on Twitter:@ddubrovskyFX