[ad_1]
EUR/USD ANALYSIS
EUR/USD retreated on Wednesday, falling to a three-month low around the 1.0700 handle, as strong U.S. economic data increased the probability of additional FOMC policy firming in 2023, reinforced the case for a restrictive monetary policy position for an extended period and propelled U.S. Treasury yields upwards, with the 2-year yield comfortably breaking above the 5.0% threshold.
Focusing on catalysts, the ISM non-manufacturing PMI showed that the U.S. services sector grew strongly in August, rising to 54.5 versus the expected 52.5, reaching its highest mark since February, a sign that the U.S. economy remains remarkably resilient and that sturdy demand pressures may prevent inflation from slowing materially towards the 2.0% target in the coming months.
Navigate the forex market with confidence and improve your strategies. Download the euro’s quarterly forecast for key insights on EUR/USD!
Recommended by Diego Colman
Get Your Free EUR Forecast
US DATA AT A GLANCE
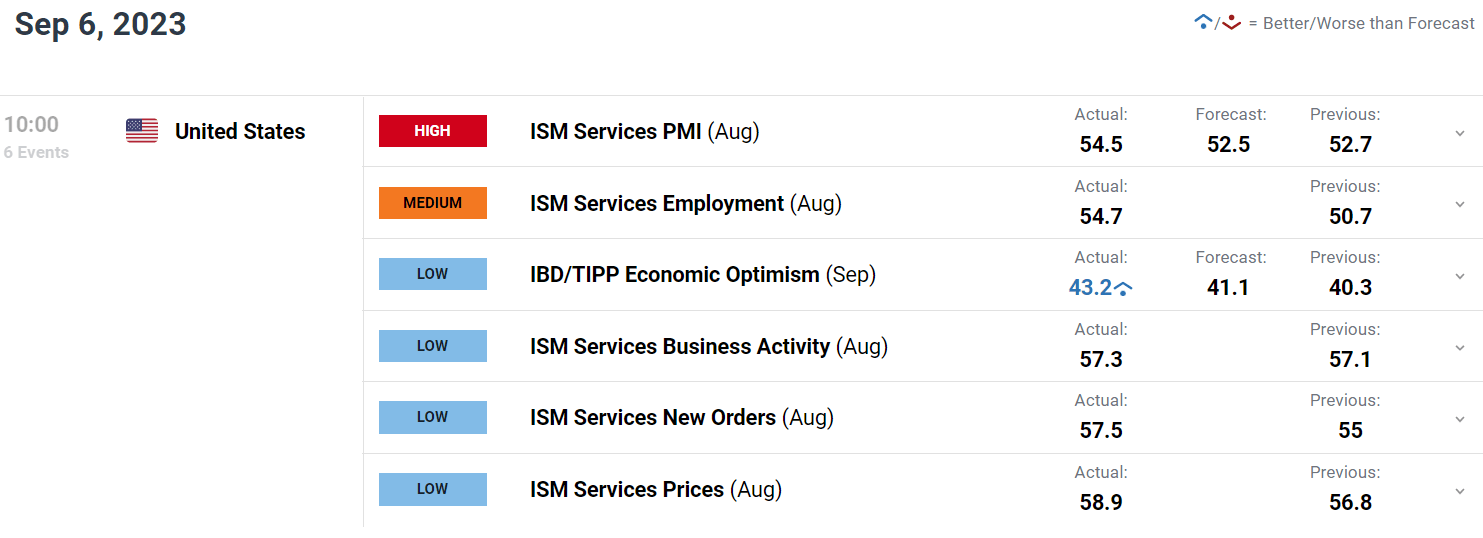
Source: DailyFX Economic Calendar
Although the Fed has pledged to “proceed carefully”, upside surprises in macroeconomic indicators could prompt policymakers to reevaluate their “cautious” approach, potentially nudging them towards contemplating additional hikes in 2023 or, at the very least, fully committing to a “higher-for-longer” strategy. This scenario could weigh on EUR/USD, especially if the Eurozone economy weakens further.
FOMC INTEREST RATE EXPECTATIONS
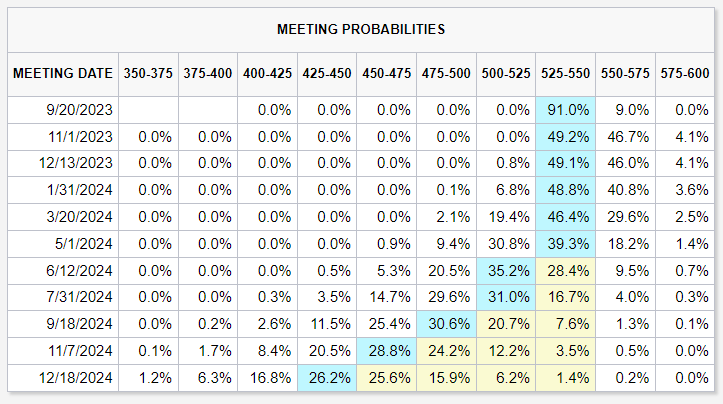
Source: CME FedWatch Tool
Stay ahead of EUR/USD trends. Download the sentiment guide to understand how positioning data can offer clues about market trajectory!
| Change in | Longs | Shorts | OI |
| Daily | 4% | 9% | 5% |
| Weekly | 51% | -22% | 16% |
EUR/USD TECHNICAL ANALYSIS
EUR/USD began a rapid descent last week, breaking below its 200-day moving average before heading towards its weakest level since June today.
With bearish momentum prevailing, it may only be a matter of time before sellers drive the exchange rate towards 1.0610, the 38.2% Fibonacci retracement of the September 2022/July 2023 rally. In the event of further weakness, the possibility of a pullback towards the psychological 1.0500 cannot be ruled out.
Conversely, if buyers step in and ignite a bullish recovery, initial resistance appears at 1.0770, followed by 1.0820, the 200-day SMA. Moving higher, the next resistance levels are situated at 1.0845 and 1.0880, respectively.
EUR/USD TECHNICAL CHART
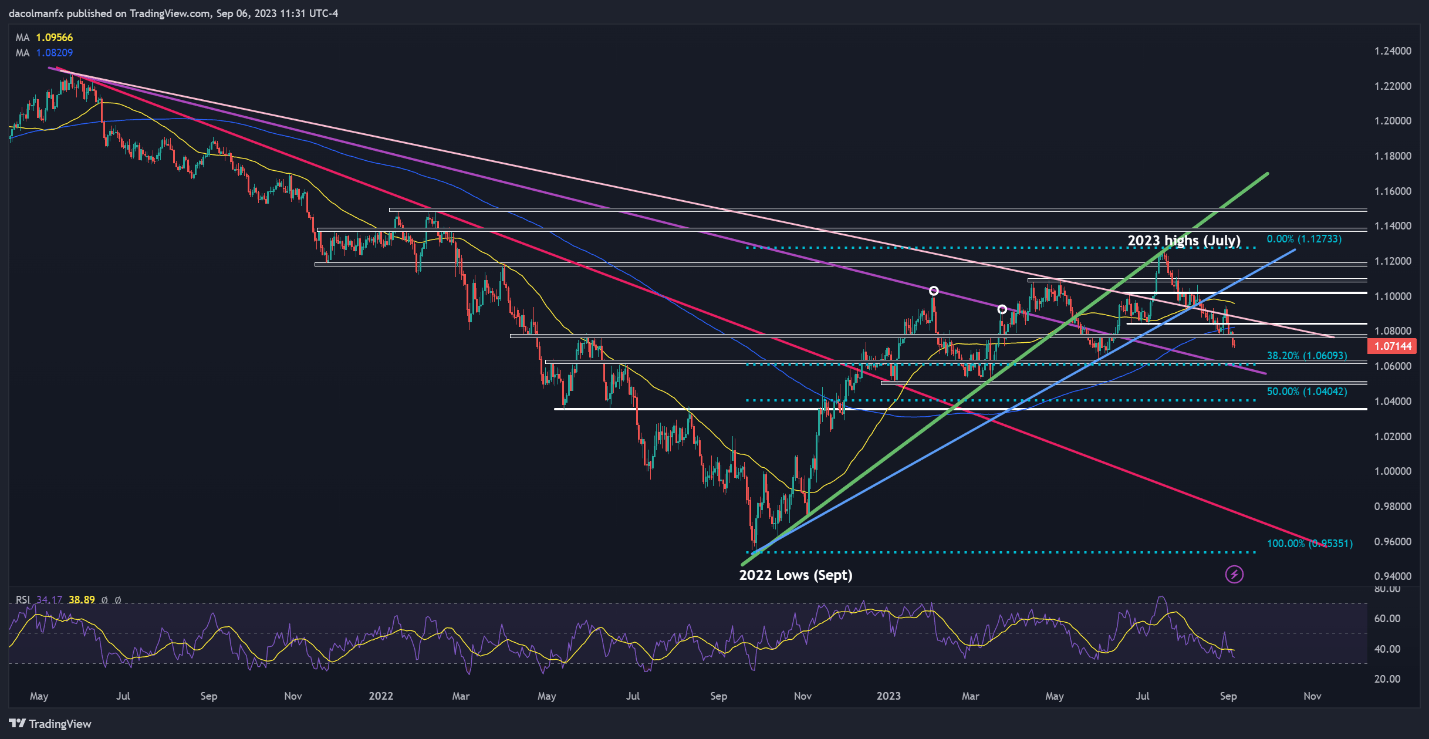
EUR/USD Chart Created Using TradingView
Boost your trading skills with the ‘How to Trade EUR/USD’ guide. Get your free guide now!
Recommended by Diego Colman
How to Trade EUR/USD
[ad_2]