
EUR/USD Price, Chart, and Analysis
- Q4 q/q growth flatlines, y/y misses expectations.
- Fed chair Powell’s hawkish testimony hammers EUR/USD.
Recommended by Nick Cawley
Trading Forex News: The Strategy
Most Read: US Dollar Rallies as Powell Issues Hawkish Pledge, Signals Higher Peak Rates
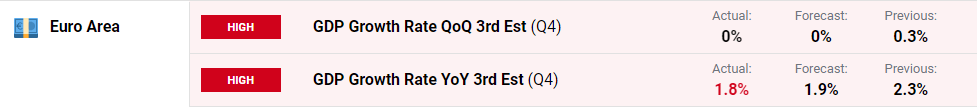
Euro Area q/q growth flatlined in the last three months of 2022, in line with market expectations, while y/y growth rose by 1.8%, a fraction under market forecasts, according to the Eurostat, the statistical office of the European Union. Greece (+1.4%) recorded the highest increase of GDP compared to the previous quarter, followed by Malta (+1.2%) and Cyprus (+1.1%). The highest decreases were observed in Poland (-2.4%), Estonia (-1.6%) and Finland (-0.6%). The Euro Area recorded growth of 0.3% in the third quarter.
For all market-moving events and economic data releases, see the real-time DailyFX Calendar
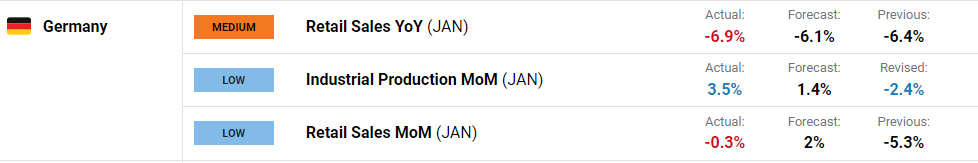
German data released earlier today showed retail sales weakening by more than expected while industrial production picked up sharply, beating forecasts easily.
EUR/USD is little changed post-GDP data and remains at, or very close to, lows last seen at the start of January. A further re-pricing of US interest rate expectations, fueled by Fed chair Jerome Powell’s hawkish testimony to the Senate yesterday, powered the greenback higher against a range of currencies and hit risk sentiment hard. US 2-year bond yields touched a fresh 15-year high of 5.04%, while markets are now pricing in a 50 basis point rate hike at this month’s FOMC policy meeting.
EUR/USD broke out of the bearish flag formation we have following recently and currently trades just below 1.0550. Big figure support at 1.0500 is likely to hold any further sell-off in the short term although if Friday’s US Jobs Report is stronger-than-expected, this level will come under heavy pressure. Below here, 1.0460 comes into play.
EUR/USD Daily Price Chart – March 8, 2023
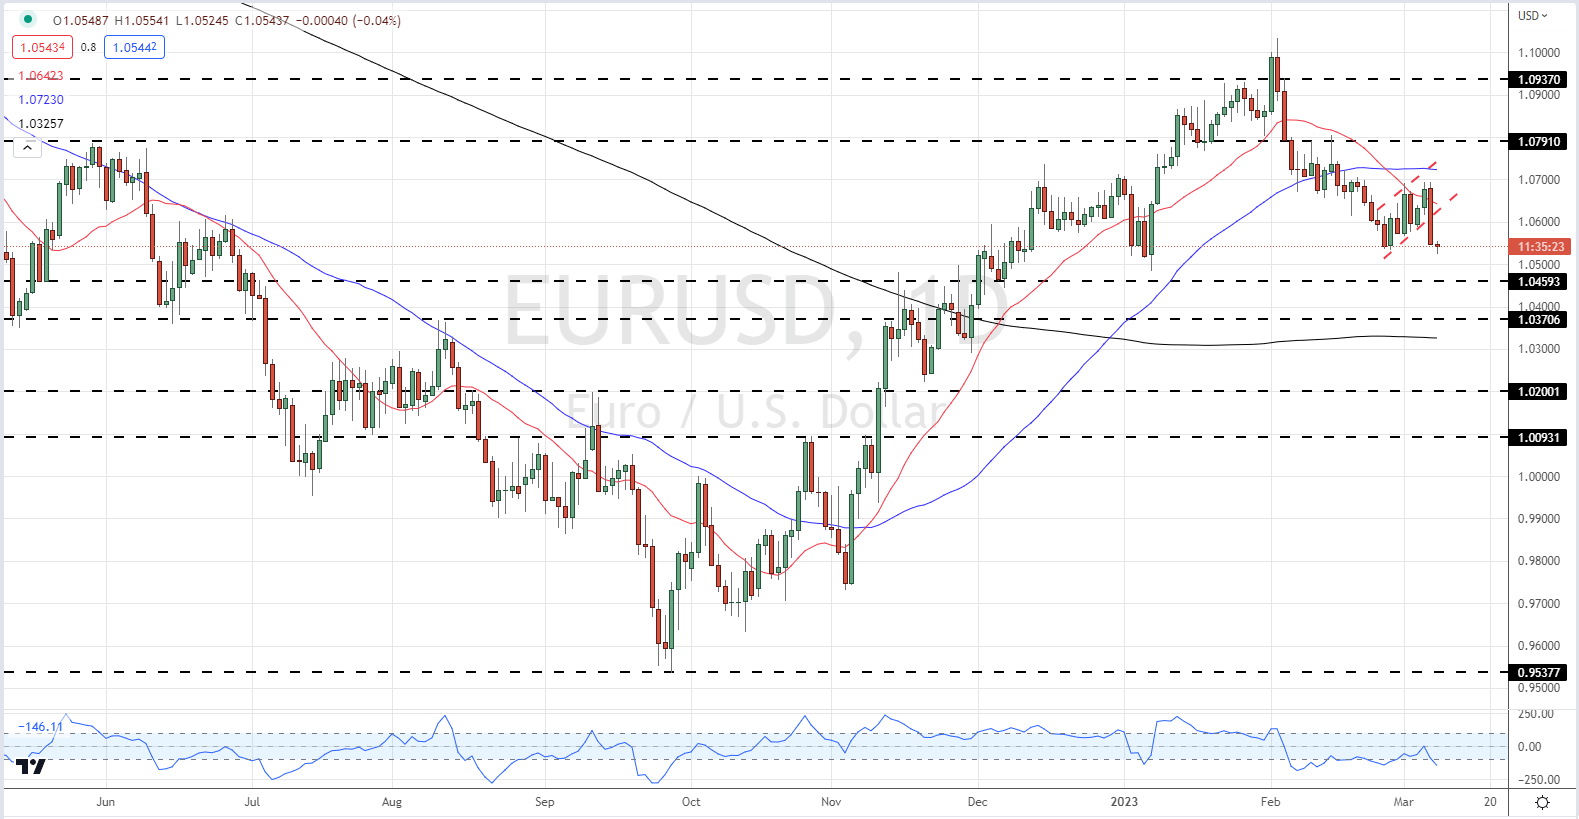
Chart via TradingView
| Change in | Longs | Shorts | OI |
| Daily | 45% | -33% | 2% |
| Weekly | 36% | -29% | 3% |
Big Shift in Retail Positioning – Traders Ramp Up Long Positions
Retail trader data show 64.84% of traders are net-long with the ratio of traders long to short at 1.84 to 1.The number of traders net-long is 44.15% higher than yesterday and 22.52% higher from last week, while the number of traders net-short is 41.19% lower than yesterday and 21.20% lower from last week.
We typically take a contrarian view to crowd sentiment, and the fact traders are net-long suggests EUR/USD prices may continue to fall. Traders are further net-long than yesterday and last week, and the combination of current sentiment and recent changes gives us a stronger EUR/USD-bearish contrarian trading bias.
What is your view on the EURO – bullish or bearish?? You can let us know via the form at the end of this piece or you can contact the author via Twitter @nickcawley1.