
Euro, EUR/USD, US Dollar, EUR/JPY, Japanese Yen, ECB, Lagarde, EZ CPI – Talking Points
- Euro bounced off a Fibonacci technical against the US Dollar level this week
- EUR/JPY has been charging north with the Yen depreciation well underway
- Euro-wide CPI later today might signal ECB action. Will that lift EUR/USD?
Recommended by Daniel McCarthy
How to Trade EUR/USD
EUR/USD MACRO VIEW
The Euro continues to gain ground going into the Thursday session after 3-days of rallying off the 2-month low seen last Friday against the US Dollar.
Against the Japanese Yen, the Euro traded at its highest level since 2008 overnight and the acute disparity in monetary policy appears to be playing out.
USD/JPY made a 10-month high on Tuesday with no sign of the Bank of Japan in currency markets at this stage.
At the recent Jackson Hole economic symposium, European Central Bank (ECB) President Christine Lagarde raised her concerns about inflation but was less prescriptive about the rate path.
Nonetheless, she made it clear that rates will stay high for as long it takes to get inflation down.
Later today the market will get the latest Euro-wide CPI read with a Bloomberg survey of economists estimating the headline number to be 5.1% year-on-year against 5.3% prior. The core CPI forecast is looking at 5.3%, below the 5.5% previously.
Yesterday saw Spanish and German CPI come in a touch higher than anticipated and a notable miss in expectations may lead to volatility in the Euro.
The data can be viewed live, as it happens, on the DailyFX calendar here.
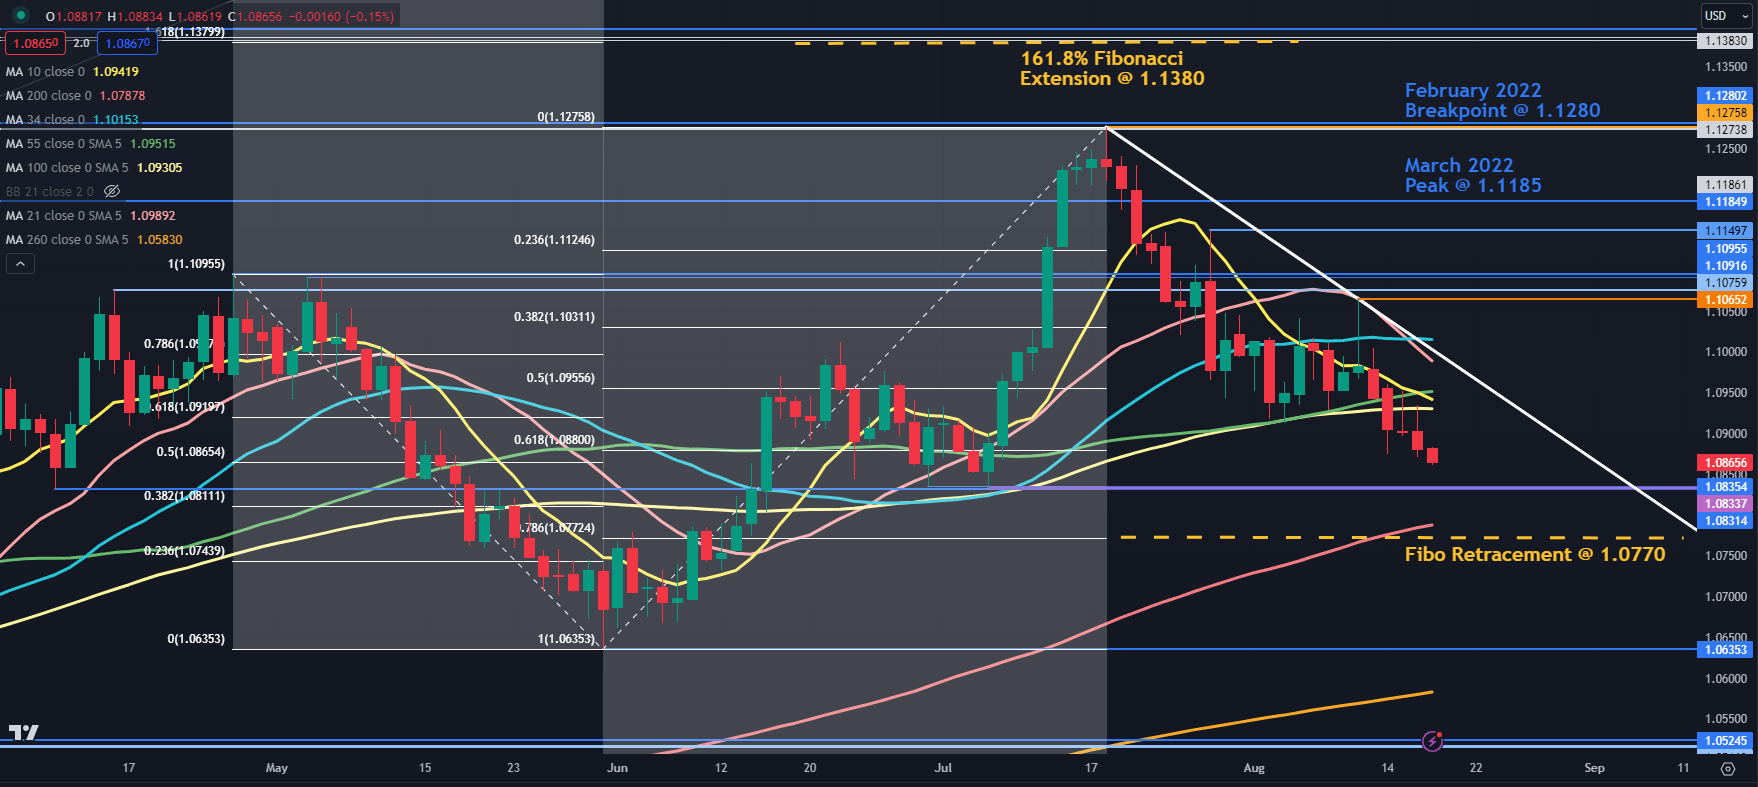
EUR/USD DAILY TECHNICAL ANALYSIS SNAPSHOT
EUR/USD broke above a descending trend line overnight on the back of 3-days of solid gains so far this week.
In doing so, it cleared 21- and 200-day simple moving averages (SMA) and a series of breakpoints.
These indicators might now provide support with the 21-day SMA at 1.0904, the breakpoints in the 1.0830 – 1.0835 area and the 200-day SMA currently at 1.0814.
Support could also be near the 78.6% Fibonacci Retracement level at 1.0770. This level held last week and saw a bounce after it was tested.
If it were to rally, nearby resistance could be at the 55-day SMA near 1.0970.
Potential resistance might also be offered in the 1.1065 – 1.1095 area where several historical breakpoints reside along with a recent high and just ahead of the psychological level at 1.1100.
Further up, resistance could be at the breakpoint from the March 2022 high at 1.1185 or the recent peak at 1.1275, which coincides with two historical breakpoints.
Above those levels, resistance might be at the Fibonacci Extension of the move from 1.1095 to 1.0635 at 1.1380. Just above there are some more breakpoints in the 1.1385 – 95 area.
To learn more about Fibonacci technical analysis, click on the banner below.
Recommended by Daniel McCarthy
Traits of Successful Traders
Trade Smarter – Sign up for the DailyFX Newsletter
Receive timely and compelling market commentary from the DailyFX team
Subscribe to Newsletter
— Written by Daniel McCarthy, Strategist for DailyFX.com
Please contact Daniel via @DanMcCarthyFX on Twitter