
[ad_1]
Gold (XAU/USD), USD Talking Points Ahead of NFP’s
- Gold prices surrender gains after hawkish FOMC minutes raises the prospects of more aggressive rate hikes.
- XAU/USD falls to technical support at prior resistance as a long-wick candle highlights a critical zone of resistance
- USD strength returns ahead of NFP (non-farm payrolls)
Recommended by Tammy Da Costa
Get Your Free Gold Forecast
Gold Prices Surrender to Dollar Strength Ahead of NFP Report – Hawkish Fed Weighs on XAU/USD
Gold prices have pulled back from their recent high as rate expectations and recession risks continue to drive sentiment.
With the recent FOMC commentary reaffirming the Fed’s commitment to raise interest rates further, the US Dollar pared losses, limiting XAU/USD gains.
Although the Federal Reserve dashed hopes of a near-term pivot at the November meeting, a tight labor market could support more restrictive tightening for the remainder of the year. As the probability of another 50-point basis hike at the next FOMC rises following the commentary, a stronger NFP (non-farm payrolls) report will likely contribute to gold’s next move.
Recommended by Tammy Da Costa
How to Trade Gold
Gold (XAU/USD) Technical Analysis
However, with the hawkish narrative weighing on the safe-haven metal throughout last year, a rebound off the October low of 1618.3 helped cap the downward move.
After rising by 15.63% since then, XAU/USD reached a high of 1871.3 before surrendering a portion of recent gains.
With a potential shooting star formation appearing on the weekly chart, the 50% Fibonacci retracement of the 2022 move has formed an additional barrier of resistance at 1848.6.
*A shooting star formation occurs when a sharp rise is followed by a steep pullback resulting in a low-bodied candle and a long-wick which signifies an important zone of resistance. *
Gold (XAU/USD) Weekly Chart
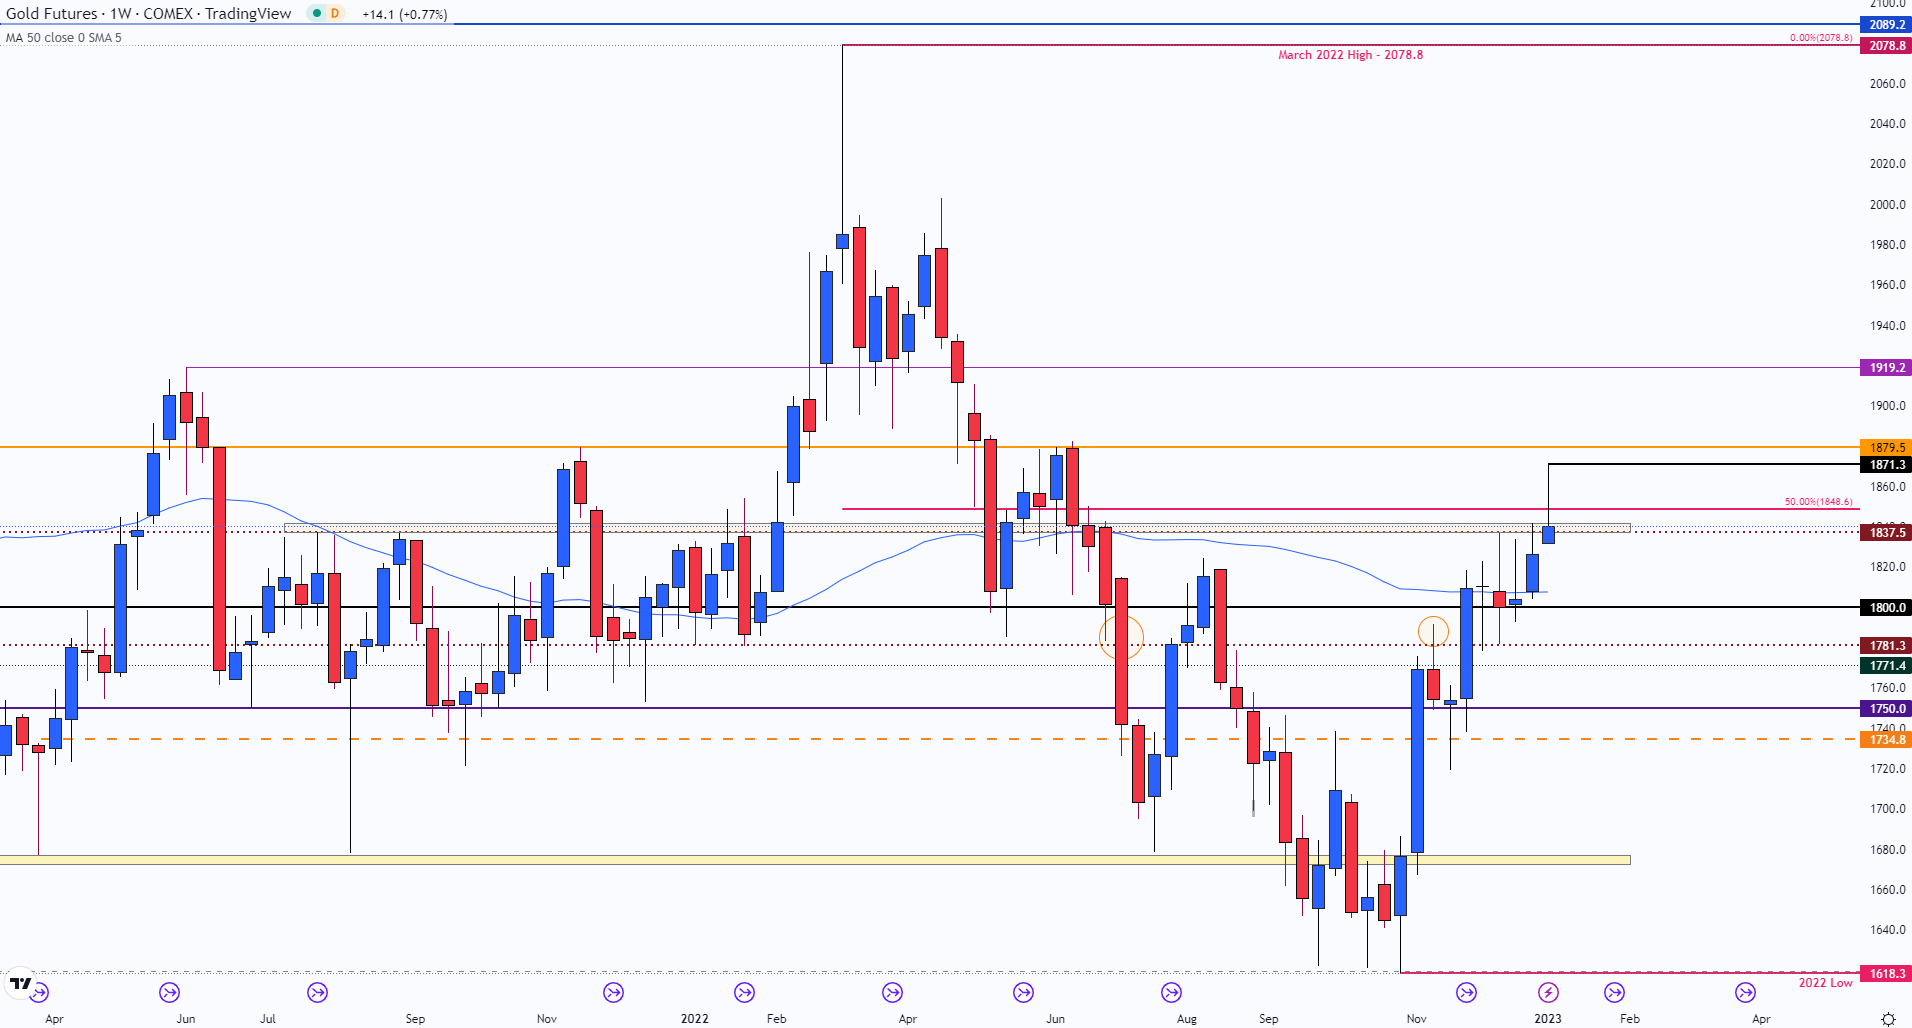
Chart prepared byTammy Da Costausing TradingView
If the candlestick pattern is validated by a close below the December 27 weekly high of 1841.9, it is possible for the upside move to remain under pressure.
Looking Ahead: Gold Technical Levels
From a shorter-term timeframe, the daily chart further highlights levels support and resistance levels that remain relevant to the precious metal.
If the non-farm payroll report beats expectations, XAU/USD may continue to decline driving prices towards the next level of support at the August 2022 high of 1824.
Gold (XAU/USD) Daily Chart
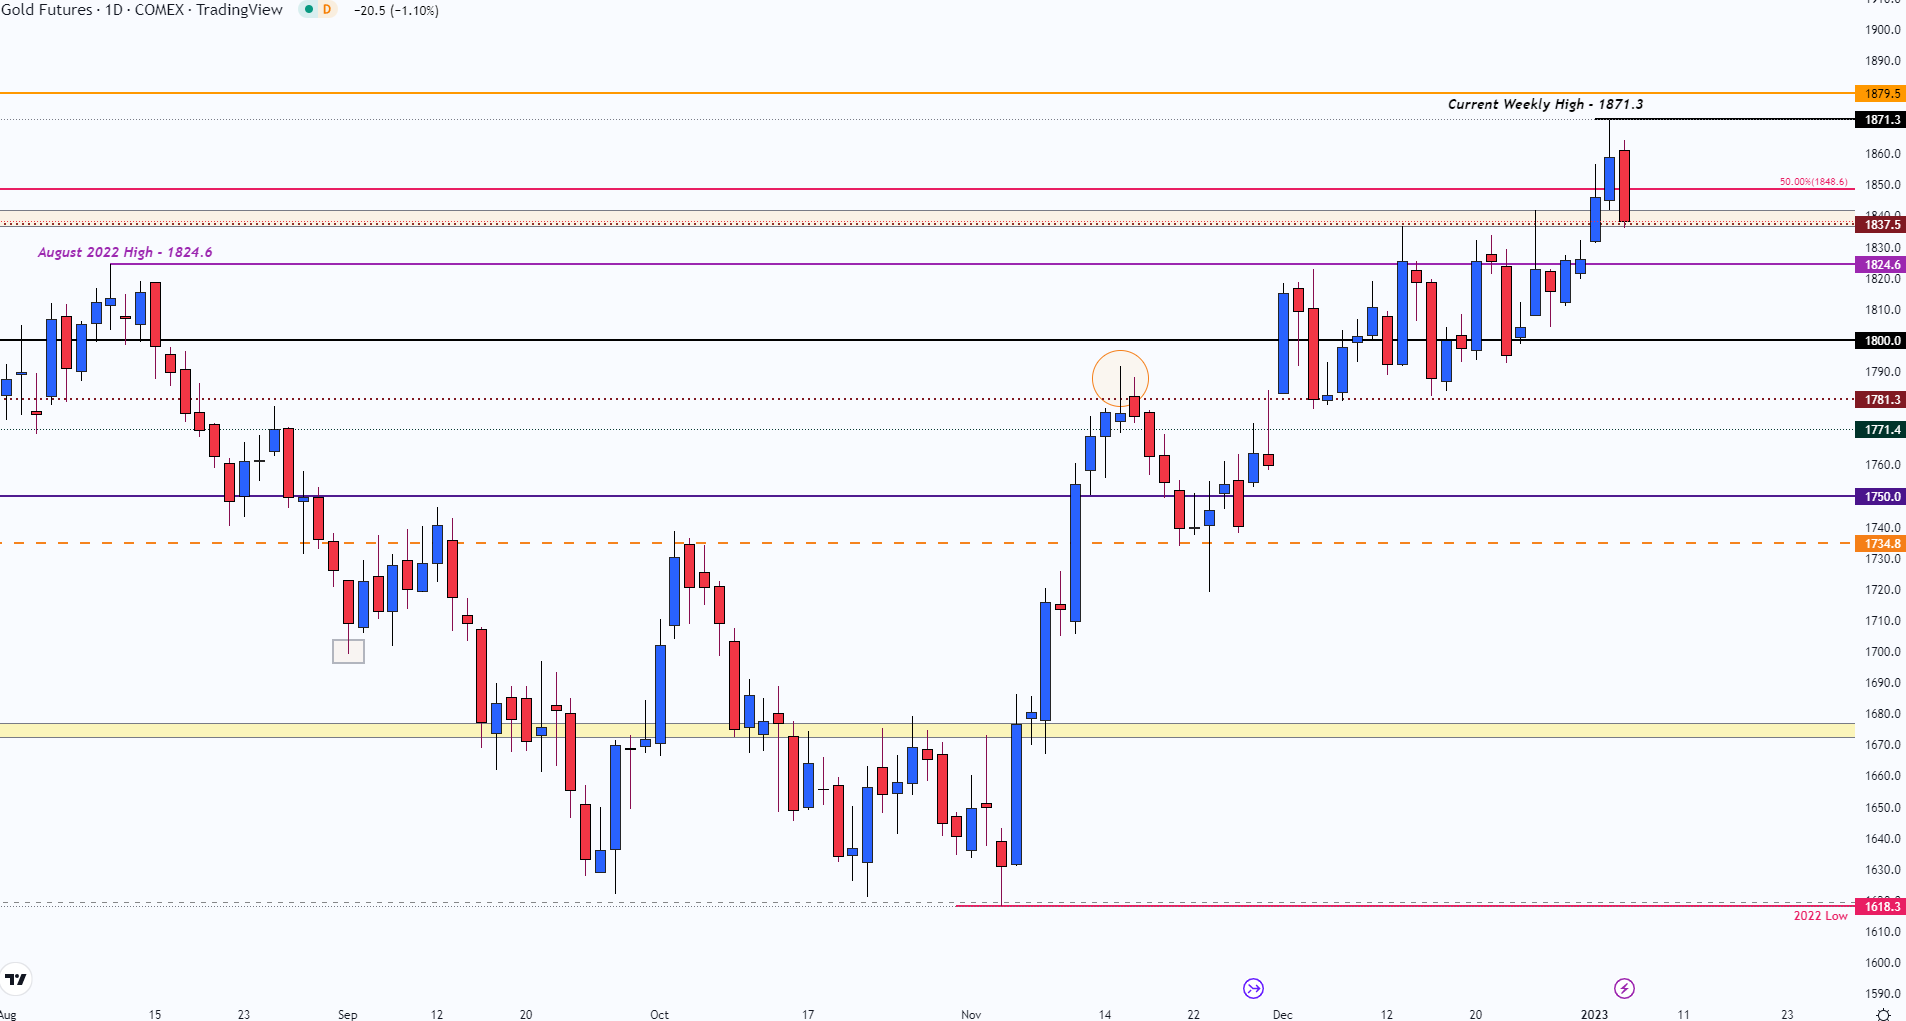
Chart prepared by Tammy Da Costausing TradingView
A move lower and the resurgence of USD strength could then pave the way for a sharper pullback driving gold prices back towards major psychological support at the prior resistance level of 1800.
Trade Smarter – Sign up for the DailyFX Newsletter
Receive timely and compelling market commentary from the DailyFX team
Subscribe to Newsletter
— Written by Tammy Da Costa, Market Writer for DailyFX.com
Contact and follow Tammy on Twitter: @Tams707
[ad_2]