GOLD PRICE FORECAST:
Recommended by Zain Vawda
Get Your Free Gold Forecast
MOST READ: Canadian Dollar Outlook: USD/CAD, GBP/CAD Rise, Is the Oil Correlation Dead?
Gold prices continue to hover around the $1900 support handle following a brief push lower yesterday. Sellers were unable to maintain the momentum however, with the precious metal closing just above the $1900 mark but more importantly closing below the 200-day MA for the first time since December 2022.
DOLLAR INDEX AND FEDERAL RESERVE (FOMC) MINUTES
The Dollar Index which has had a huge say in Golds recent struggles finds itself at a key inflection point ahead of the Fed minutes later today. Upbeat retail sales data yesterday helped keep the Greenback supported just as it appeared to be on its way down from the confluence area around the 103.00 handle.
As global markets face renewed concerns around the economic recovery in China it is the Dollar which continues to attract the safe haven bids rather than Gold which is understandable given the current rates on offer.
The Dollar Index (DXY) remains at a key confluence around the 103.00 handle as it ran into the 200-day MA. I still think there is scope for Dollar downside after the Fed minutes with downside toward the 50 and 100-day MA. More uncertainty around China however, and a continued battle between risk-on and risk-off sentiment could see the Dollar remain supported due to its ongoing safe haven appeal with a break of the descending trendline coming into focus.
Dollar Index (DXY) Daily Chart – August 16, 2023
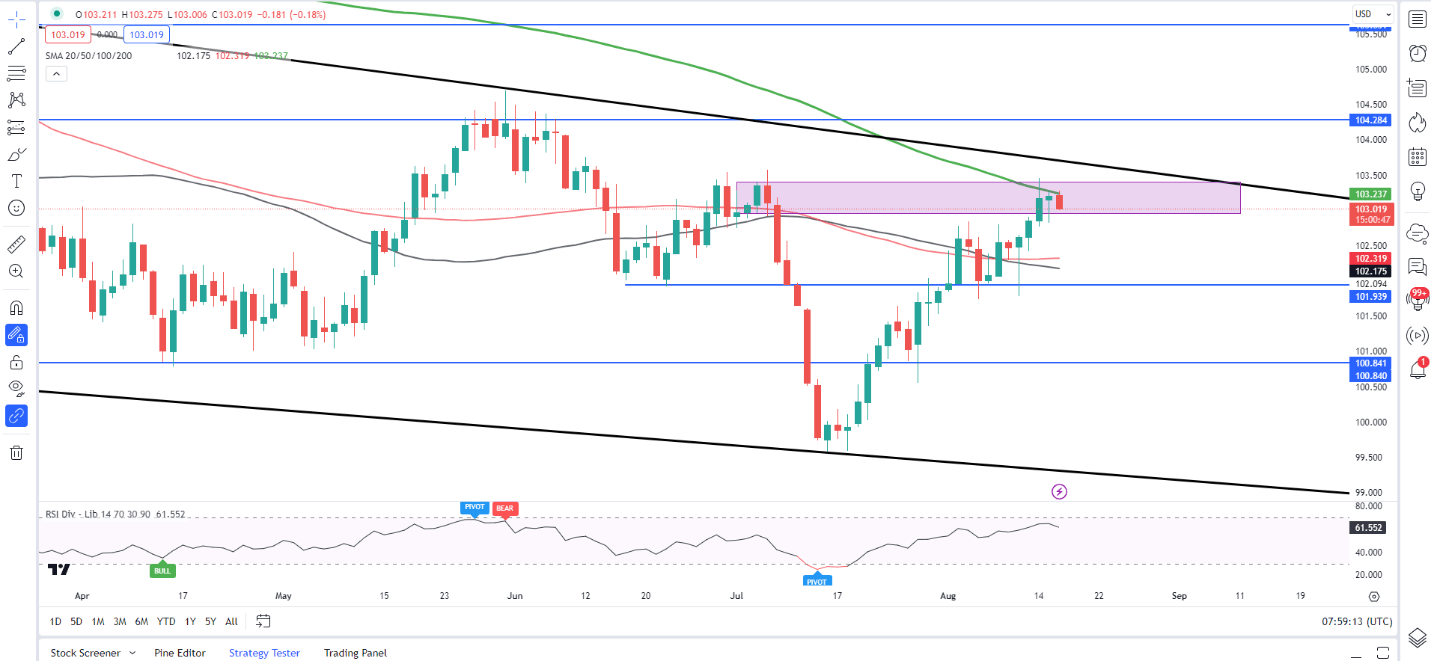
Source: TradingView, Chart Prepared by Zain Vawda
TECHNICAL OUTLOOK AND FINAL THOUGHTS
Form a technical perspective, Gold prices have closed below the 200-day A on a daily timeframe for the first time since December 2022. This is a strong indication that the longer-term trend may be shifting as gold loses its shine with attractive yields also weighing on the precious metal.
Further downside definitely remains a possibility, however the RSI (14) is approaching overbought territory which s=means a short-term bounce may occur before the selloff continues. At this stage any bounce will need to a daily close above the $1925-$1930 (pink rectangle on the chart) for me to be convinced of a change in momentum.
Markets do appear to be largely driven by the fundamental and macro pictures at the moment and thus my initial thoughts are that any move will likely be dependent on the risk tone today as well as how market participants perceive the FOMC minutes later in the day.
Gold (XAU/USD) Daily Chart – August 16, 2023
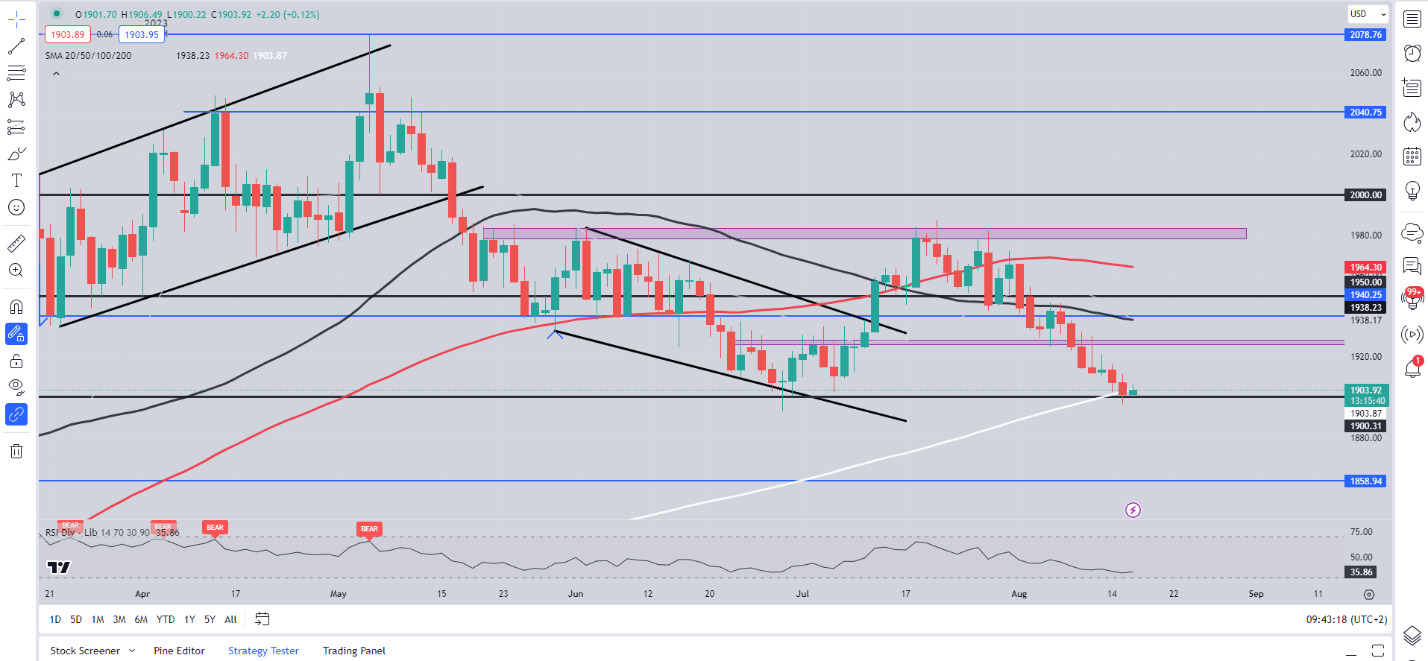
Source: TradingView, Chart Prepared by Zain Vawda
Taking a quick look at the IG Client Sentiment retail trader data shows 81% of traders are net-long on Gold.
For a more in-depth look at GBP/USD sentiment and changes in long and short positioning download the free guide below.
| Change in | Longs | Shorts | OI |
| Daily | 1% | -4% | 0% |
| Weekly | 9% | -19% | 2% |
Written by: Zain Vawda, Markets Writer for DailyFX.com
Contact and follow Zain on Twitter: @zvawda