[ad_1]
CRUDE OIL, WTI, NATURAL GAS, NG – Outlook:
- Crude oil has retreated from key resistance but hasn’t broken any support yet.
- The multi-week bullish pressure in natural gas is fading.
- What is the outlook for crude oil and natural gas and what are the key levels to watch?
Recommended by Manish Jaradi
How to Trade Oil
Natural gas: Is the rebound over?
The chances are growing that the five-month-long recovery is over. Natural gas’ fall in mid-August below 2.57 was a warning sign that the rebound is running out of steam – a risk pointed out in the previous update. See “How Much More to Go in Crude Oil? Is There More Upside in Natural Gas?”, published August 11.
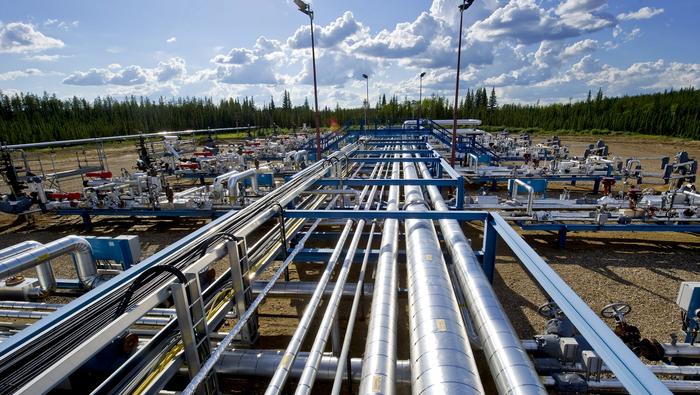
This follows a failure to cross above the crucial hurdle at 3.00-3.05 (including the March high and the 30-week moving average). As the previous update highlighted, the two steps forward one step back nature of price action characterizes the recovery as corrective, rather than the start of a new uptrend. Natural gas is testing a vital horizontal floor at about 2.45-2.50. Any break below the support would confirm that the upward pressure had dissipated, potentially opening the door toward the May low of around 2.00.
Natural Gas Weekly Chart
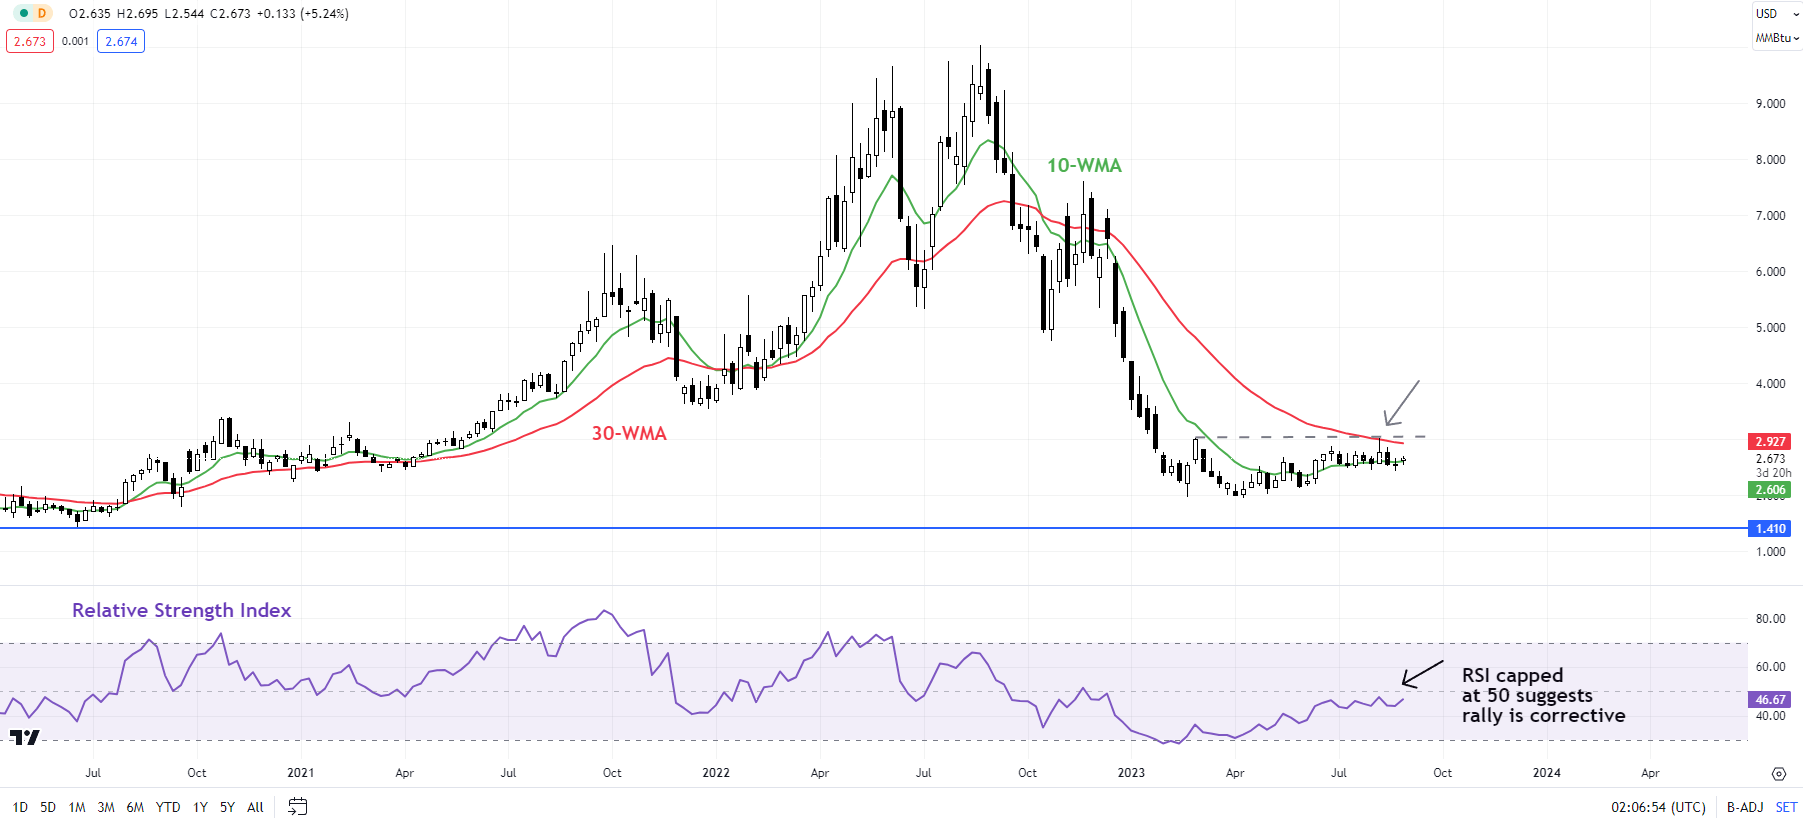
Chart Created by Manish Jaradi Using TradingView
Zooming out, the failure of natural gas to witness a meaningful upward momentum in recent months is a sign that the broader downtrend is intact. The possibility of natural gas bottoming was first highlighted in early 2023 – see “Natural Gas Price Action Setup: Is the Slide Overdone?”, published February 21, and subsequently “Natural Gas Week Ahead: Base Building May Have Started”, published May 22, and “Natural Gas Price Rebound Could Extend; What’s Next For Crude Oil?”, published May 18.
Natural Gas Daily Chart
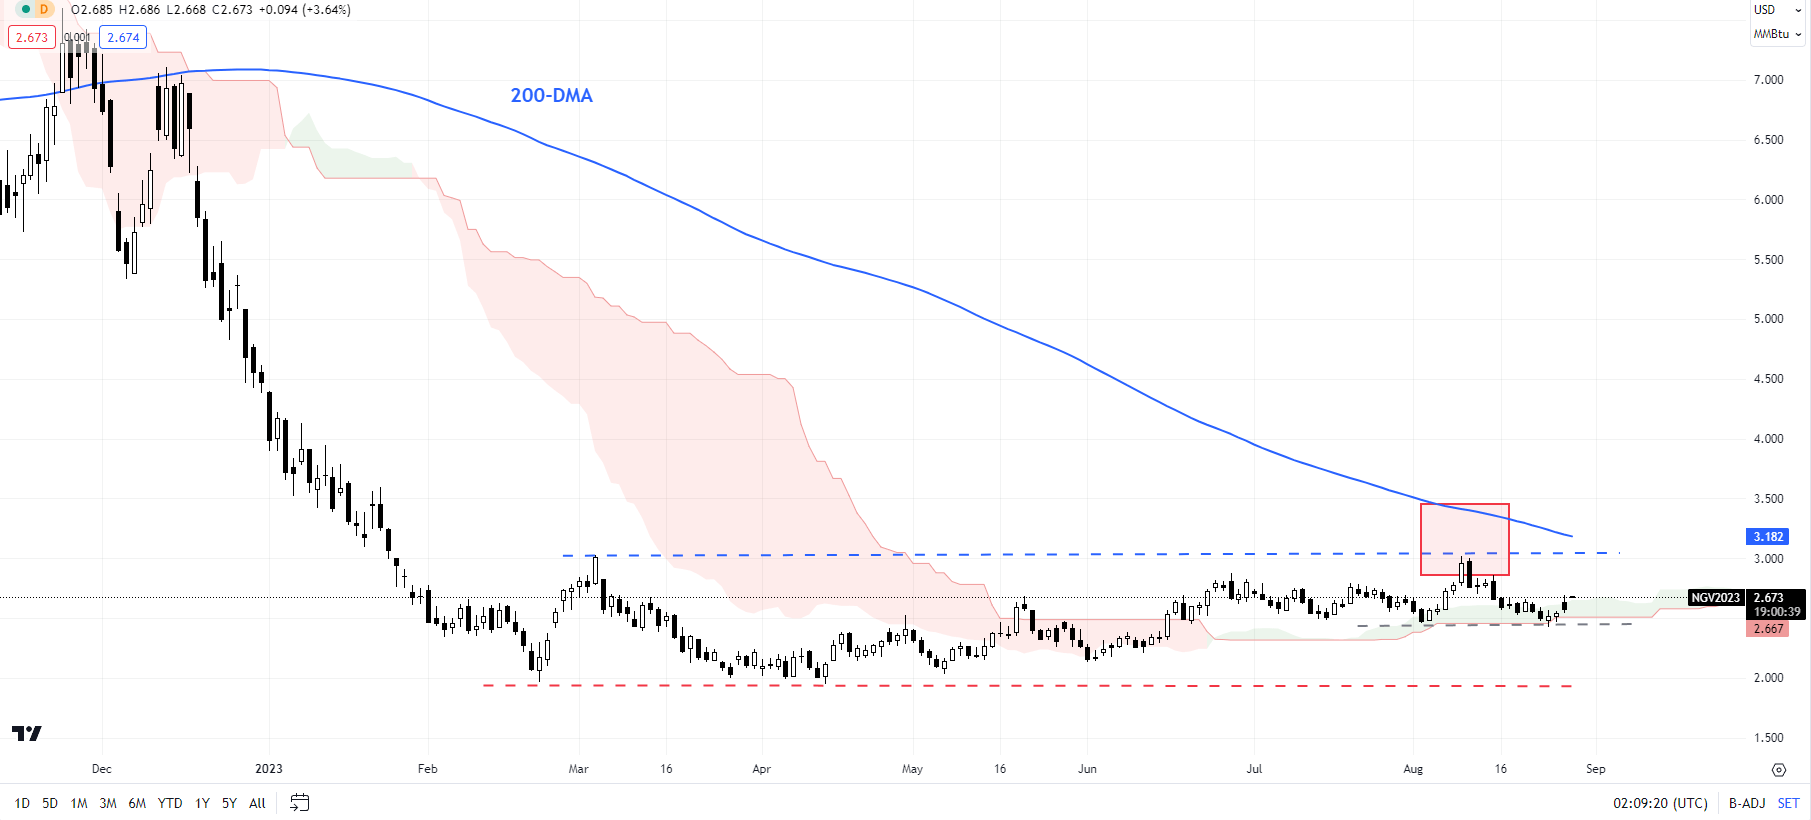
Chart Created by Manish Jaradi Using TradingView
However, the inability in recent weeks to rise toward the 200-day moving average is another sign of underlying weakness. Given the deep losses since last year, natural gas may need to undergo a prolonged period of base building before a sustainable uptrend emerges.
Crude Oil: More pain ahead?
The rise toward the April high of 83.50, a cross above the Ichimoku cloud on the daily charts, and the clearance above the 89-day moving average are signs that crude oil is beginning to flex muscles after months of subdued price action.
Crude Oil Daily Chart
Chart Created by Manish Jaradi Using TradingView
Most recently, crude oil has succumbed to vital resistance at 83.50 – a risk highlighted in theprevious update. Nevertheless, the nascent bullish trend since the end of June doesn’t appear to be over just yet. Crude oil would need to fall below the lower edge of the Ichimoku cloud on the daily chart for the short-term bullish bias to fade. Until then, the path of least resistance remains sideways to up.
Crude Oil Weekly Chart
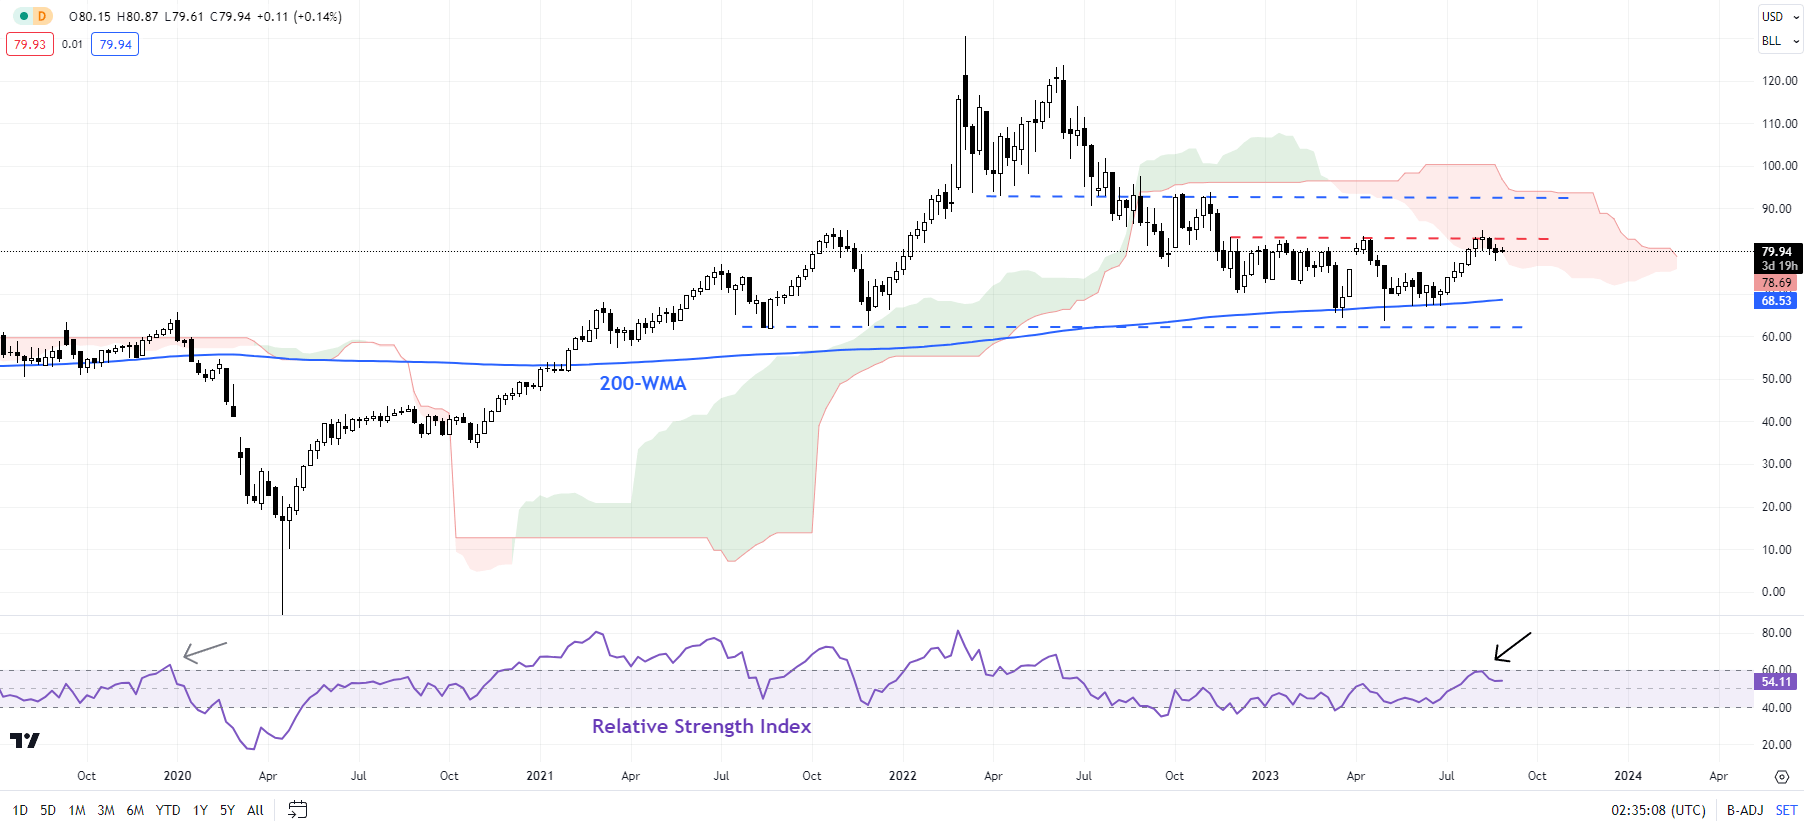
Chart Created by Manish Jaradi Using TradingView
In recent months, crude oil has found strong support on the 200-week moving average. See “Crude Oil Extends Slide in Asia: Is This Capitulation?”, published May 4. Any break above 83.50 could pave the way toward the October high of 93.00, near the upper edge of the Ichimoku cloud on the weekly charts at about 95.00. The 93.00-95.00 region needs to be cleared to put crude oil back on the appreciation path.
Recommended by Manish Jaradi
Improve your trading with IG Client Sentiment Data
— Written by Manish Jaradi, Strategist for DailyFX.com
— Contact and follow Jaradi on Twitter: @JaradiManish
[ad_2]