S&P 500 OUTLOOK:
- S&P 500 sinks on Wednesday as the U.S. banking crisis knocks on Europe’s door
- U.S. dollar rallies on flight to safety moves despite the sharp pullback in U.S. Treasury yields
- Market attention now shifts to the FOMC’s monetary policy announcement next week, with traders increasingly positioning for a dovish outcome
Recommended by Diego Colman
Get Your Free USD Forecast
Most Read: Gold and Silver Forecast – SVB Collapse Pushes Retail Traders to Boost Downside Bets
U.S. stocks were sharply lower on Wednesday as the banking storm continued to deteriorate and spread to Europe, prompting Credit Suisse Group’s shares to plunge more than 20% to their lowest level on record and sending the lender’s credit default swaps near distressed territory.
Risk-off sentiment also boosted defensive assets, bolstering U.S. Treasury prices across the board. While this move led to a sharp pullback in bond yields across the curve, the U.S. dollar managed to gain ground against most of its peers, with the DXY index up about 1.3% – a clear sign of haven demand in the FX space.
Turning to the S&P 500, the most important equity market benchmark in the world was down more than 1.5% to 3,859 around noon in New York, with financials and materials leading losses on Wall Street and utilities attempting to buck the trend considering their defensive nature compared to other sectors.
In recent days, sentiment has been on a declining path after the collapse of two key U.S. banks (SVB and SBNY). Granted, their failure involved some idiosyncratic factors, but aggressive monetary policy also played a role, with higher rates dragging the value of fixed-income assets owned by these institutions.
Investors fear that the Fed’s forceful tightening campaign could soon break something in the system and provoke a major crisis. Although policymakers have stepped up to shore up struggling lenders by providing emergency liquidity, Wall Street believes these measures are insufficient to restore calm.
In any case, we’ll hear more from the FOMC next week when it announces its March decision. Expectations are in a flux, but pricing suggests 51% odds of a quarter-point hike versus a 49% chance of no move at all. See FedWatch tool chart below for clarification.
Recommended by Diego Colman
Get Your Free Equities Forecast
INTEREST RATE EXPECTATIONS FOR THE MARCH FOMC MEETING
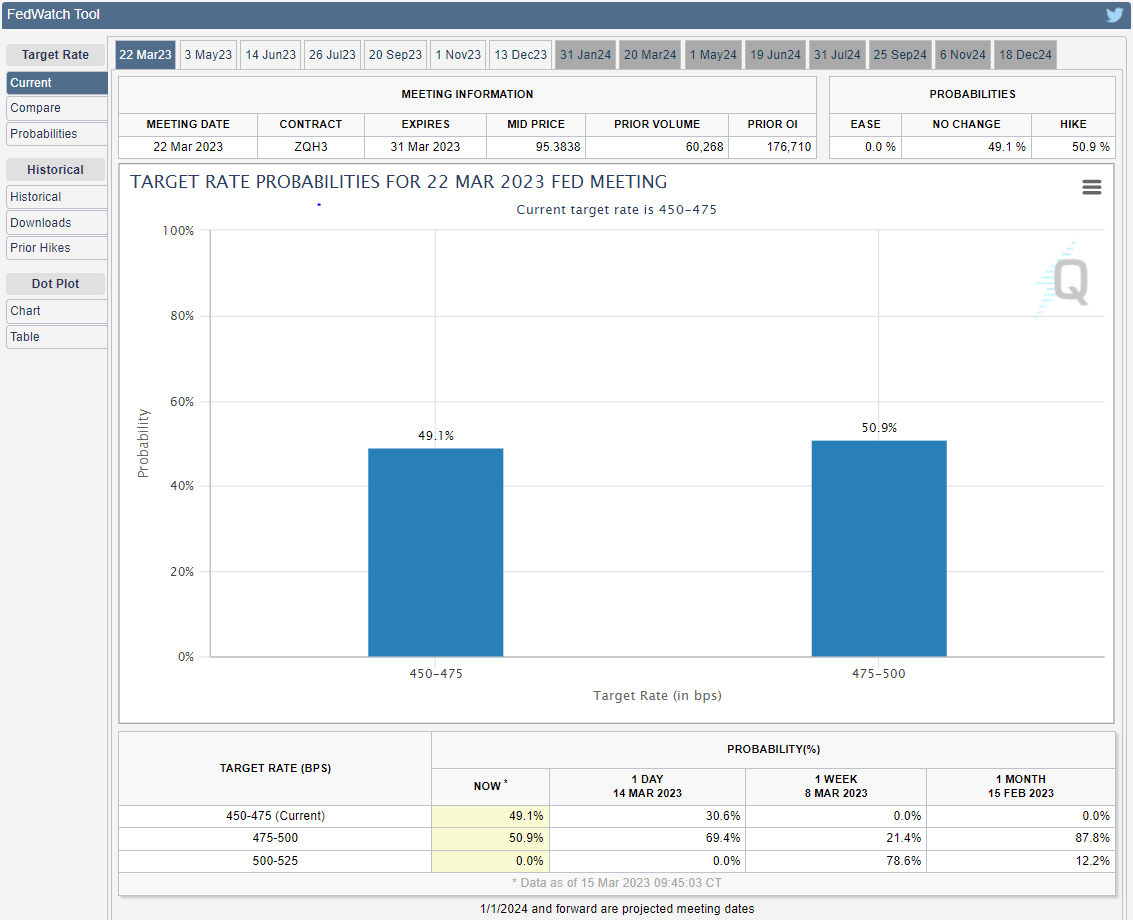
Source: CME Group
In terms of personal bias, I am inclined to believe that the central bank could deliver a 25 bp hike, but its decision could be accompanied by a dovish statement, signaling a temporary pause in the tightening cycle to safeguard the financial system at a time of heightened stress.
A pause, which could give policymakers time to monitor the situation and assess systemic risks, is likely to support the S&P 500, paving the way for a short-term rally, though gains may be short-lived considering the outlook for corporate earnings and the economy as a whole.
| Change in | Longs | Shorts | OI |
| Daily | 5% | -13% | -3% |
| Weekly | 8% | -16% | -3% |
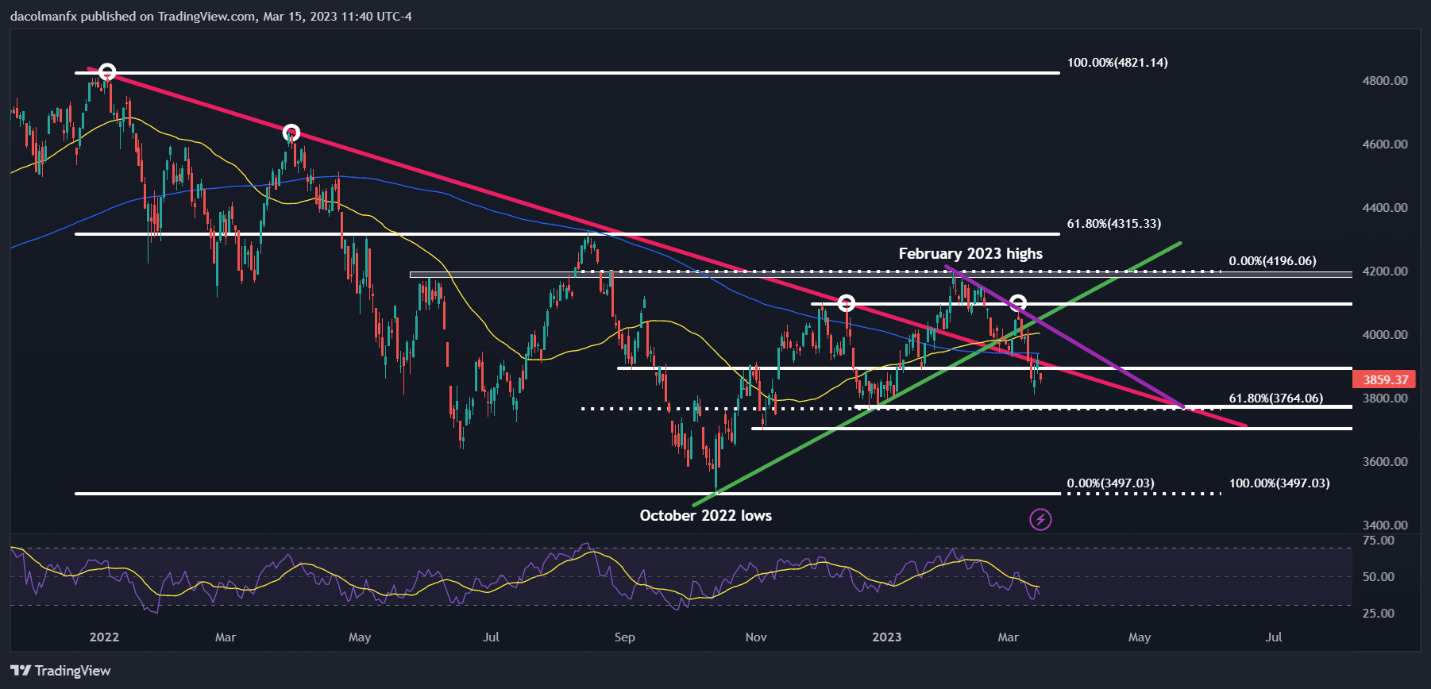
S&P 500 TECHNICAL ANALYSIS
After recent losses, the S&P 500 is firmly below its 200-day simple moving average and the long-term descending trendline that has guided prices lower since early 2022, a bearish indication. If downside pressure intensifies, initial support rests at ~3,765, near the December 2022 lows and the 61.8% Fib retracement of the October 2022/February 2023 advance. Below that, the next floor is seen at 3,700.
On the flip side, if buyers resurface and regain control of the market, driving the S&P 500 higher, the first technical resistance to monitor lies around the 3,900 area. After that, the 200-day simple moving average is the next upside focus, followed by short-term trendline resistance crossing by the psychological 4,000 level.
S&P 500 TECHNICAL CHART