
Market Recap
Recommended by Jun Rong Yeap
Get Your Free Equities Forecast
Wall Street headed higher for the fourth straight day, but this time with more measured gains as some reservations kicked in ahead of the US core Personal Consumption Expenditures (PCE) data release later today. Current consensus are for a stronger growth in the headline figure to 3.3% year-on-year (YoY) from previous 3%, along with the core aspect to 4.2% YoY from previous 4.1%. Therefore, while the broader trend for US inflation is still to the downside, there may be concerns that any persistence in pricing pressures reflected may feed into a high-for-longer rate outlook.
Aside, economic softness was the takeaway from US macro data overnight. The US Q2 Gross Domestic Product (GDP) growth rate was revised lower to 2.1% from its preliminary 2.4%, while private payrolls growth slowed more than expected (177,000 versus 195,000 forecast) – its first downside surprise in five months. US Treasury yields pared initial losses on some indecision, more notably with the two-year yields attempting to defend its 50-day moving average (MA) for now.
One to put on the radar may be the SPDR S&P Semiconductor ETF, which is back at a key level of resistance at the 210.91 level. This level marked the peak of last Thursday’s sell-off, along with heavy resistance back in February 2023. Reclaiming this level may pave the way to retest the 222.64 level next, while on the downside, the Ichimoku cloud on the daily chart seems to serve as a strong support to hold.
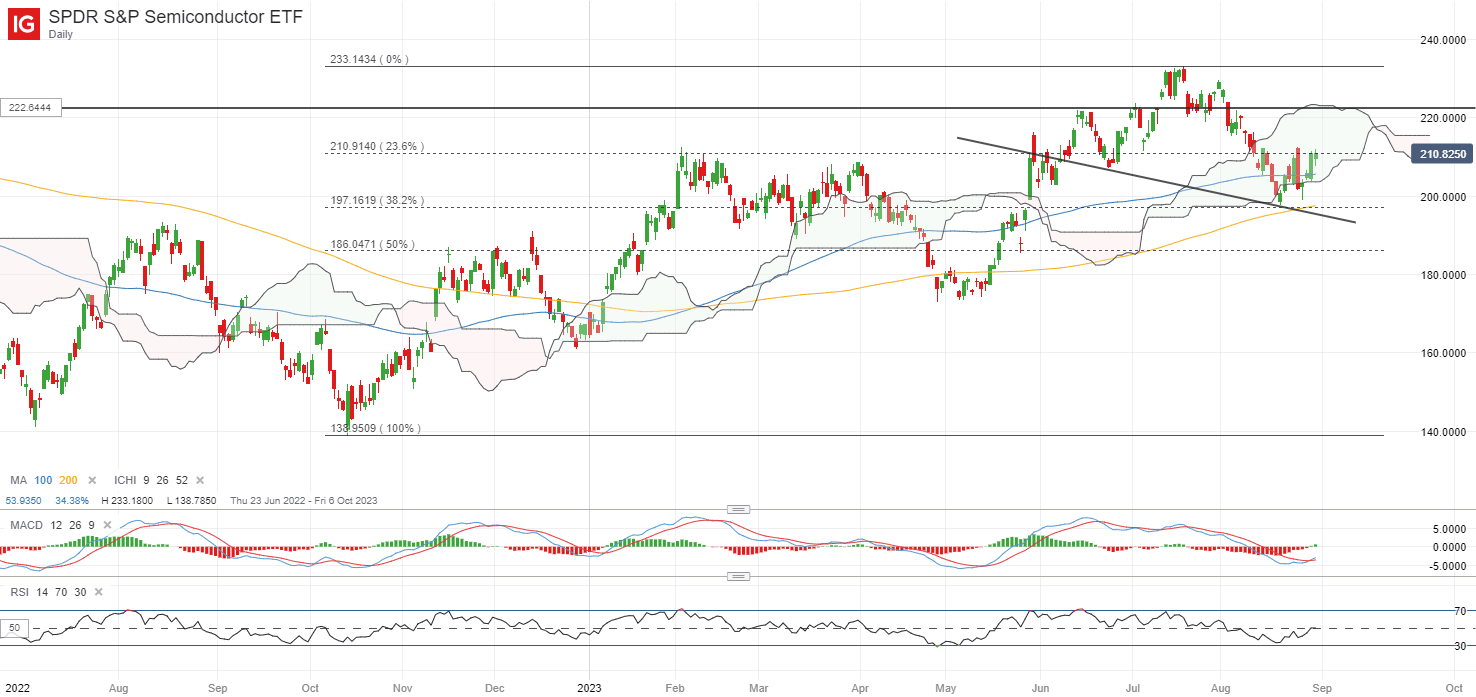
Source: IG charts
Asia Open
Asian stocks look set for a subdued open, with Nikkei +0.29%, ASX +0.05% and KOSPI -0.10% at the time of writing, displaying some wait-and-see in the lead-up to the US inflation data ahead. A slew of economic data in the region will be on watch today, with the morning starting off with a mixed showing from Japan, which could see the Bank of Japan (BoJ) retain its ultra-loose monetary policies. External global demand remains a pressure point for Japan’s July factory output (-2.0% versus -1.4% forecast), but reopening momentum continues to provide some economic cushion, with retail sales crushing expectations in July (6.8% versus 5.4% forecast).
On another front, China’s purchasing managers index (PMI) data delivered another set of subdued read, with manufacturing activities remaining in contractionary territory for the fifth straight month (49.7 versus 49.2 consensus) while reopening momentum for its services sector continue to taper (51.0 versus 51.2 consensus). Overall, it may seem that ongoing policy support has not translated to a significant turnaround in economic conditions just yet, which may call for more to be done through the rest of the year, although more measured responses will likely be the stance from authorities.
The China A50 index continues to trade on a wider consolidation pattern, reflecting some indecision as the success of policy support has not been validated thus far. The 12,300 level continues to be a key level for buyers to defend, having supported the index on at least three previous occasions. On the upside, immediate resistance may be at the 12,800 level, where an earlier rally attempt fizzles this week. Ultimately, a break above its current ranging pattern may be warranted to provide conviction of buyers in control, leaving the 13,600 level on watch over the medium term.
Recommended by Jun Rong Yeap
How to Trade FX with Your Stock Trading Strategy
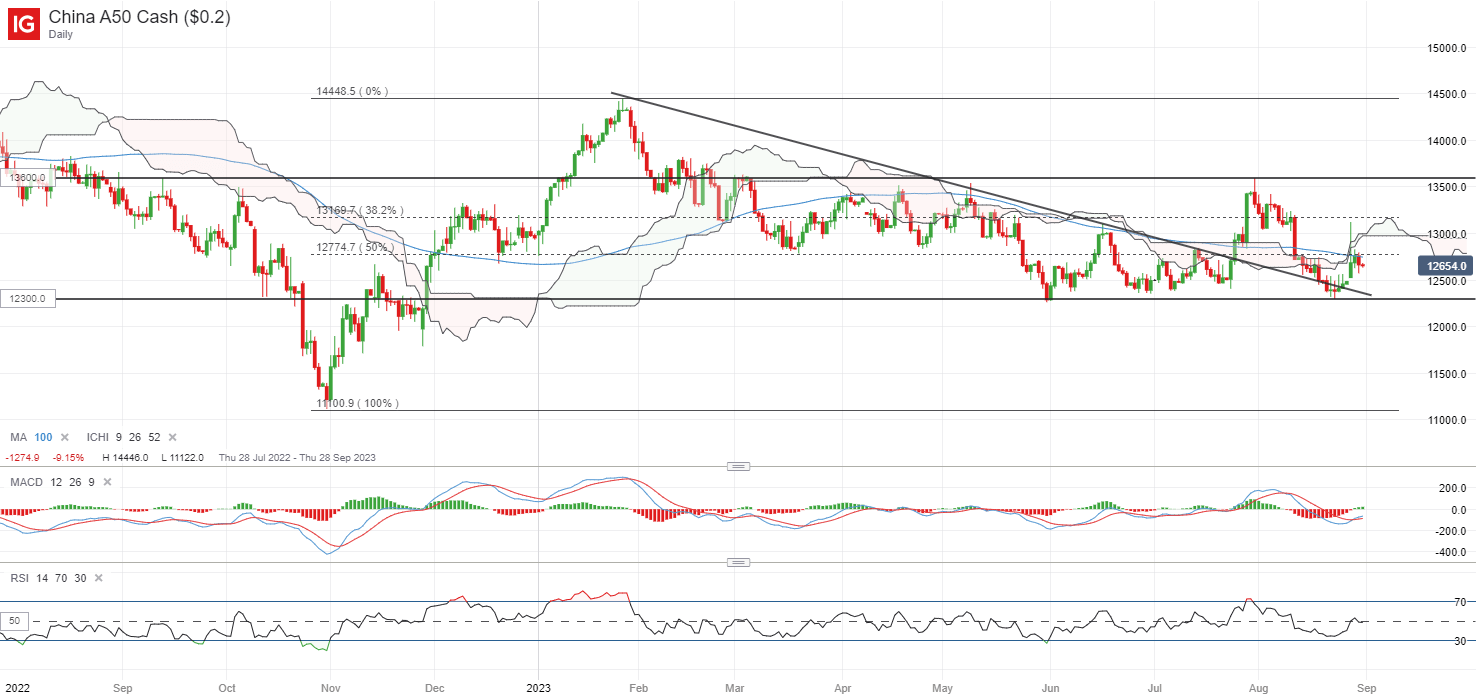
Source: IG charts
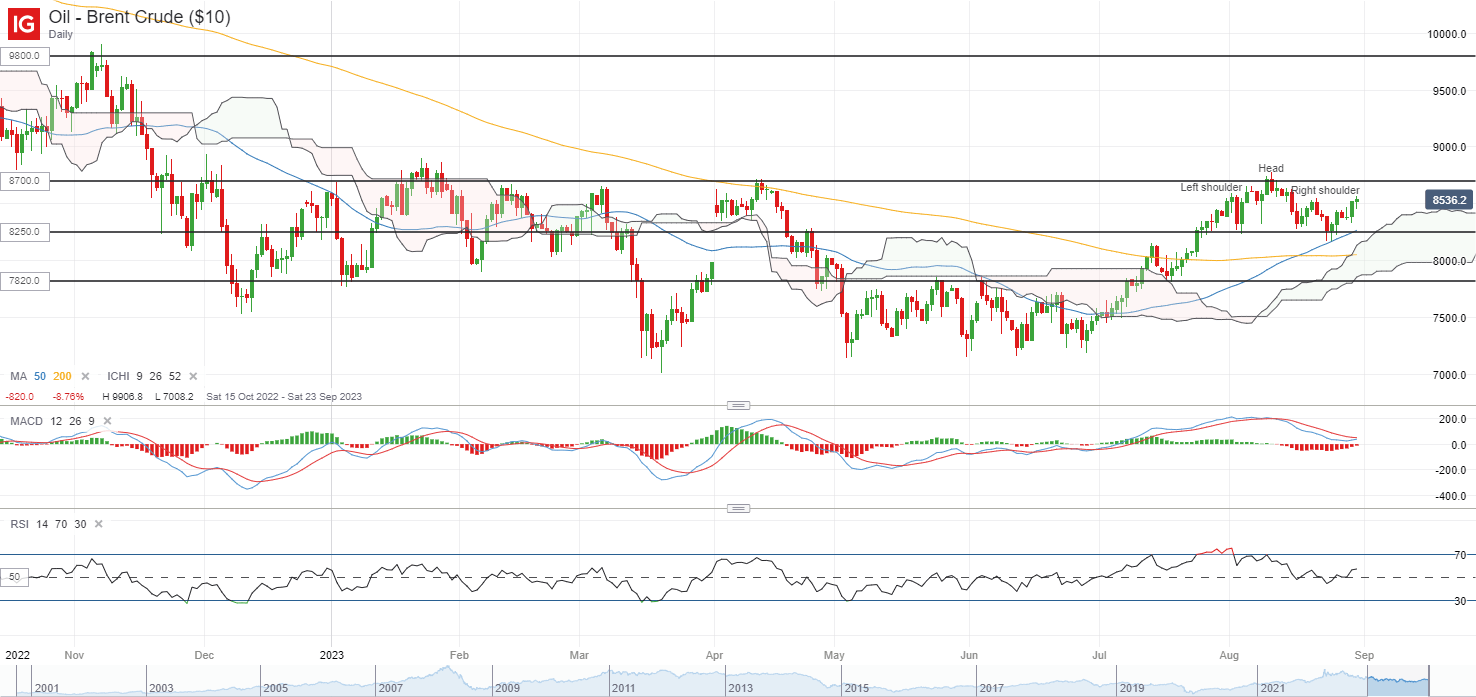
On the watchlist: Will Brent crude prices find its way to retest its year-to-date high?
Brent crude prices have pared almost all of its last week’s losses thus far, with another more-than-expected drawdown in US inventories, tensions in Gabon and concerns over a hurricane off the US gulf coast supporting a tighter-supplies outlook. That said, these are pitted against some headwinds in demand conditions, questioned by the weaker-than-expected US GDP data overnight and another set of subdued PMI read from China – the world’s second-largest oil consumer.
On the technical side, prices have manged to defend a head-and-shoulder neckline on its daily chart thus far and continues to trade above both its 50-day and 200-day MA, which may still place buyers in control. One to watch if prices will be able to reclaim its year-to-date high at the US$87.00 level, which also marked the upper bound of its wide ranging pattern since November 2022. A move above this level may potentially leave its November 2022 high at the US$98.00 level in sight.
Recommended by Jun Rong Yeap
How to Trade Oil
Source: IG charts
Wednesday: DJIA +0.11%; S&P 500 +0.38%; Nasdaq +0.54%, DAX -0.24%, FTSE +0.12%