
SPX (US S&P 500), NDX (NASDAQ 100) Latest:
- US 500 (S&P 500) resilience holds ahead of FOMC minutes
- Nasdaq 100 lacks clarity as tech stocks suffer
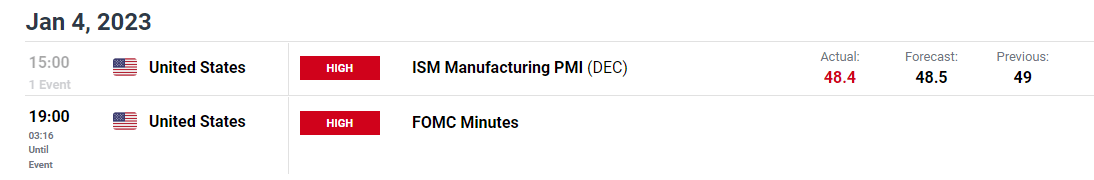
- ISM manufacturing PMI data falls to 48.4, slightly softer than the forecast of 48.5
Recommended by Tammy Da Costa
Get Your Free Equities Forecast
US equity futures remain under pressure as S&P 500 and the Nasdaq 100 trade within a well-defined range. With interest rates and inflation fueling recession risks last year, the geopolitical backdrop continues to be monitored closely.
As the Federal Reserve prepares to deliver the first FOMC minutes for 2023, the release of US ISM manufacturing data has done little to boost sentiment.
Discover How Forex Traders Use ISM Data
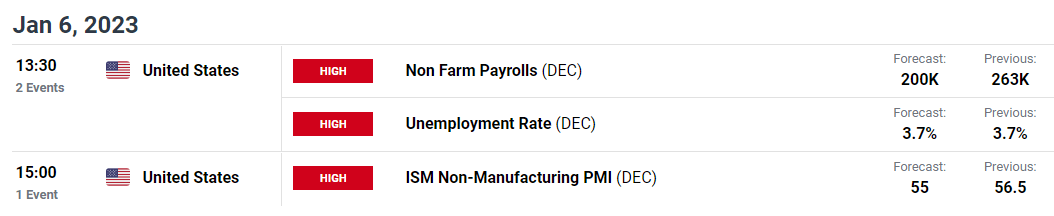
Although the December report came in slightly lower than expected at 48.4 (vs 48.5 est), the November JOLTs report (which measures the number of job openings for a specific period) places this week’s NFP (non-farm payroll) report at the forefront of risk sentiment.
DailyFX Economic Calendar
Foundational Trading Knowledge
Macro Fundamentals
Recommended by Tammy Da Costa
With the S&P 500 and NASDAQ 100 sensitive to rate expectations and recession risks, the major stock indices continue to trade cautiously ahead of the FOMC minutes.
As SPX futures hover above the 61.8% Fibonacci retracement of the 2020 – 2022 move at 3815.2, a move lower could see the index retesting another key level from the 2022 move at 3773.15.
S&P 500 (SPX) Futures Daily Chart
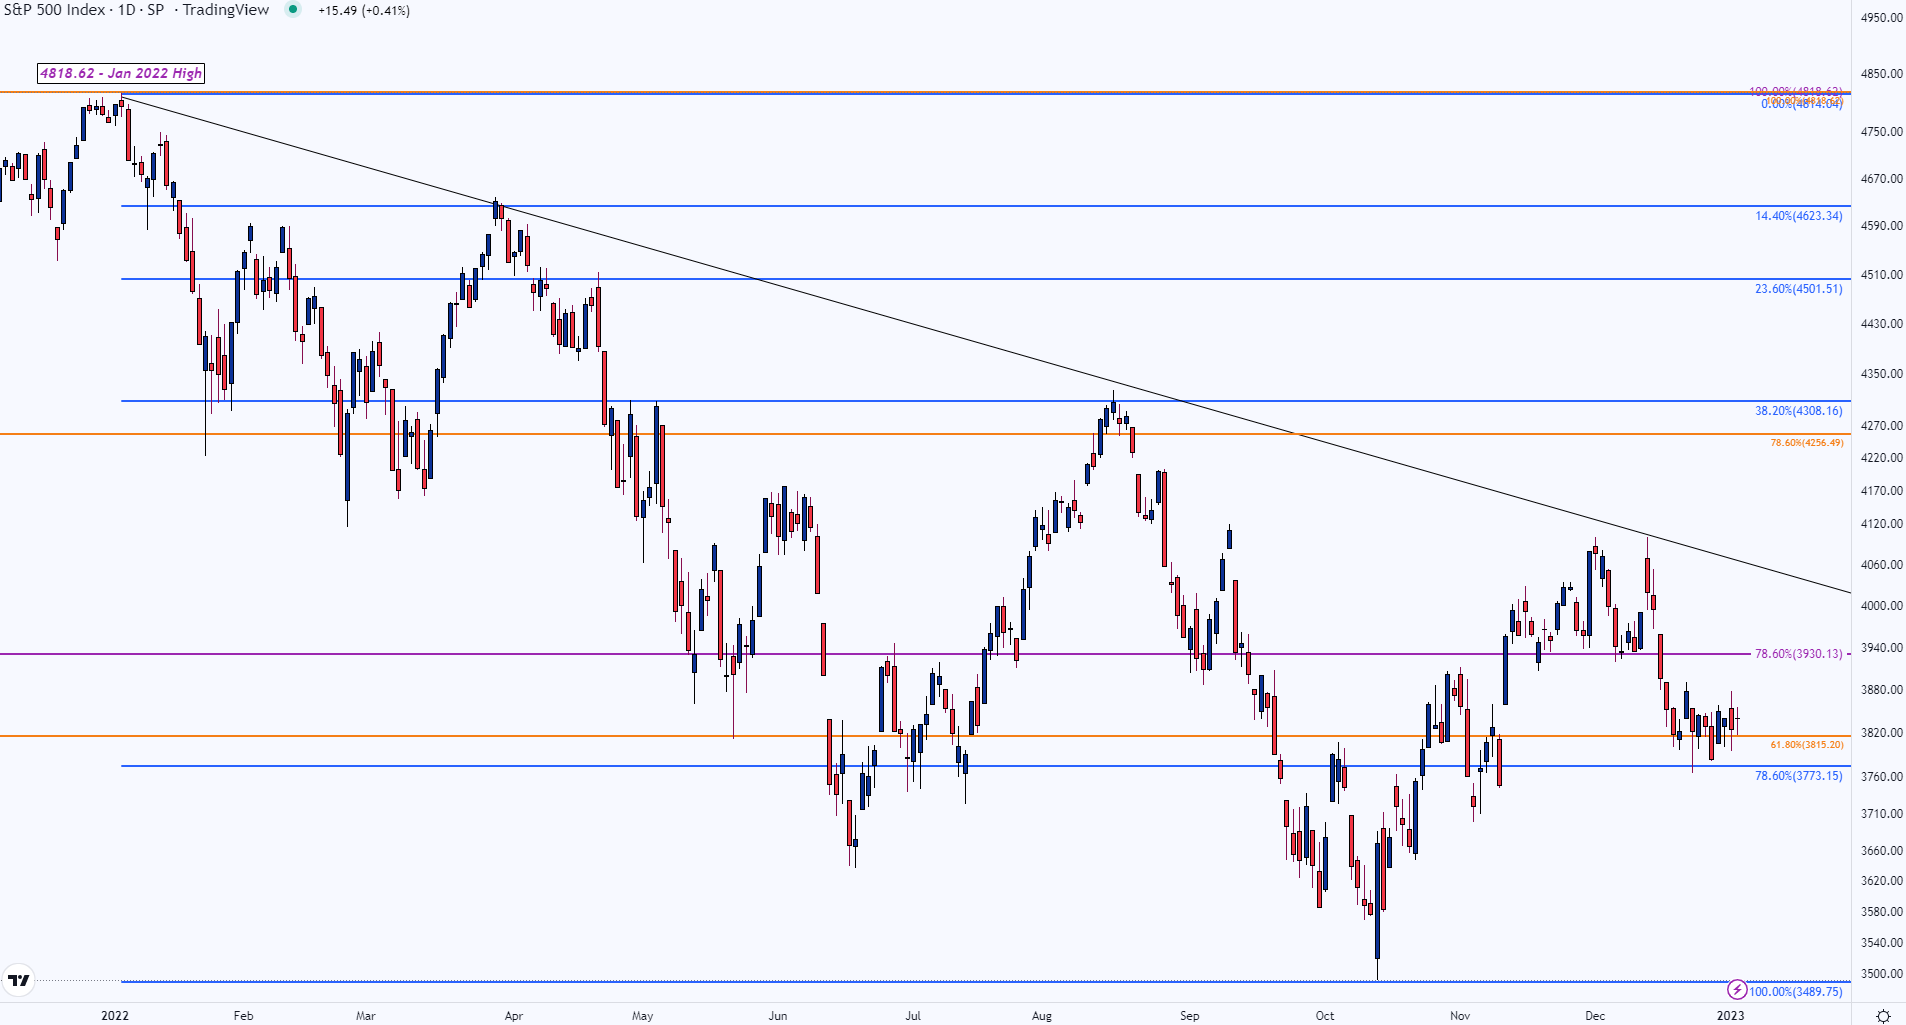
Chart prepared by Tammy Da Costa using TradingView
Meanwhile, with the 78.6% Fibonacci from the longer-term move providing resistance around the 3930 handle, a move higher could see S&P 500 rising back towards the next resistance level at the key psychological level of 4000.
| Change in | Longs | Shorts | OI |
| Daily | 6% | -5% | 1% |
| Weekly | 1% | -4% | -1% |
— Written by Tammy Da Costa, Analyst for DailyFX.com
Contact and follow Tammy on Twitter: @Tams707