Gold Price (XAU/USD) Prices, Chart, and Analysis
- Gold remains rangebound as the US Jobs Report nears.
- An escalation of geopolitical risks will underpin gold’s haven status
Download our brand new Q1 2024 Gold Forecast below
Recommended by Nick Cawley
Get Your Free Gold Forecast
The monthly US Jobs Report hits the screens today at 13.30 UK with expectations of a further hiring slowdown in nonfarm payrolls. The survey, representing around 486k individual worksites provides detailed data on employment, hours, and earnings. Today’s survey is expected to show 150k new jobs added in December, while the unemployment rate is seen ticking 0.1% higher to 3.8%. The Federal Reserve actively monitors labor market conditions and today’s report will be closely watched as the US central bank mulls the timing of the first interest rate cut this year.
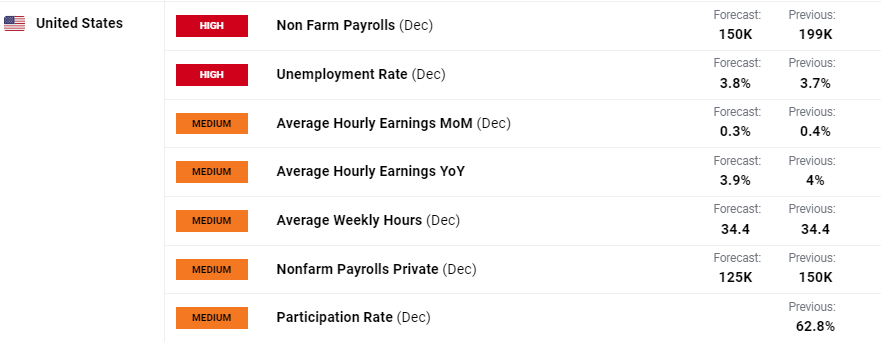
For all economic data releases and events see the DailyFX Economic Calendar
The precious metal’s haven status may be buoyed in the coming days and weeks as global geopolitical risks increase. The ongoing Russia/Ukraine war shows no sign of slowing down, tensions between China and Taiwan remain heightened, Israel’s military action in the Gaza Strip continues, while major shipping chokepoints in the Red Sea disrupt global supply chains daily. An increase in any of these conflicts will underpin gold.
Gold is quiet at the start of Friday’s session and will remain that way until today’s jobs numbers are released. The CCI indicator reading is neutral, while the current $8/oz. trading range is around one-third of the latest 14-day ATR reading. Support around the $2,032/oz. held an earlier test this week but is unlikely to keep sellers at bay if the NFP numbers show a stronger-than-expected labor market. The next level of support is seen at $2,009/oz.
Gold Daily Price Chart
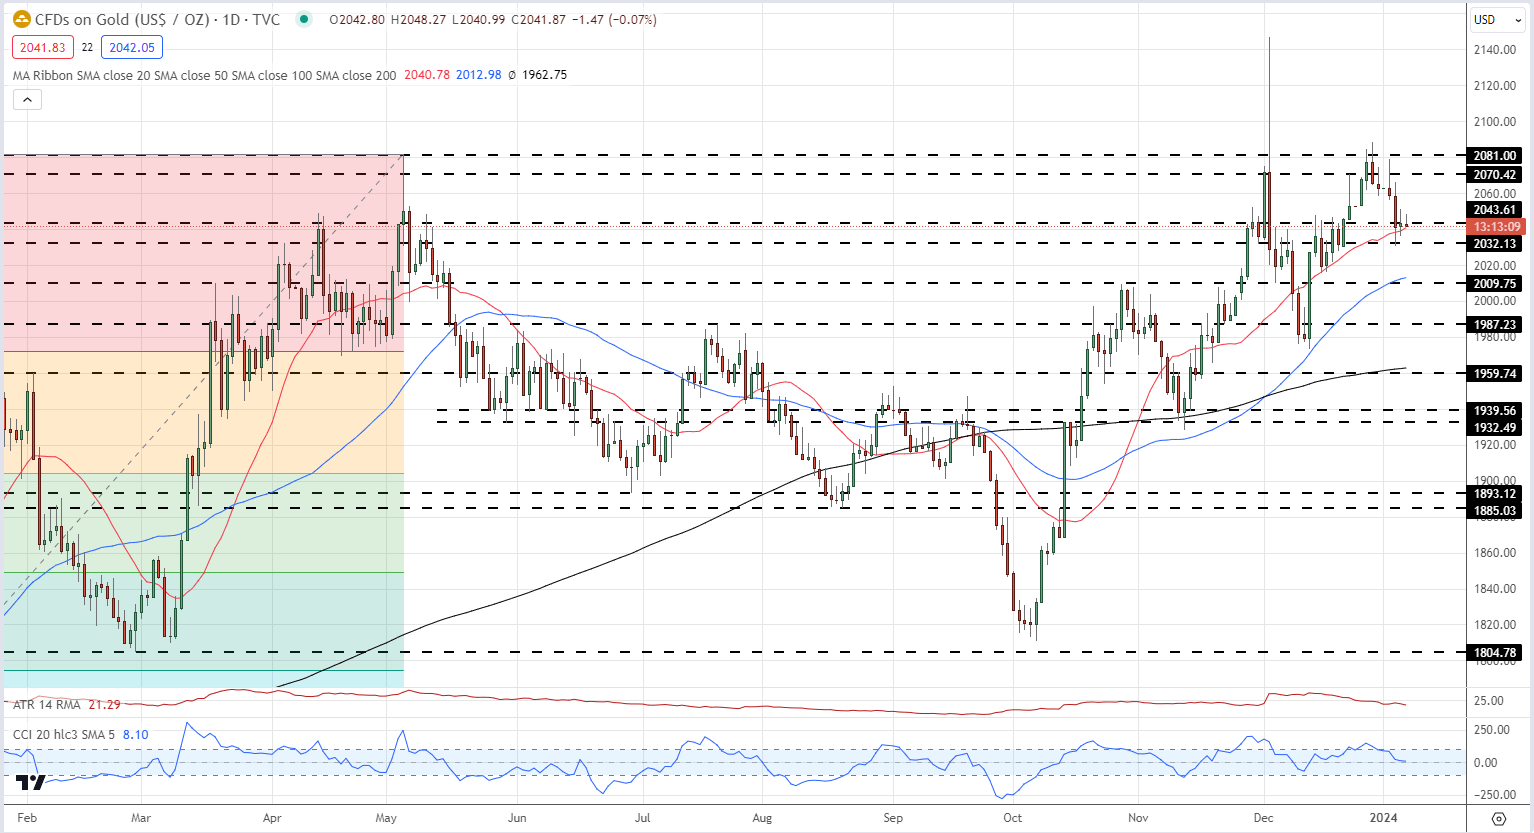
Chart via TradingView
Retail trader data shows 57.48% of traders are net-long with the ratio of traders long to short at 1.35 to 1.The number of traders net-long is 2.50% lower than yesterday and 4.17% lower than last week, while the number of traders net-short is 7.82% higher than yesterday and 2.23% lower than last week.
We typically take a contrarian view to crowd sentiment, and the fact traders are net-long suggests Gold prices may continue to fall.
See how changes in IG Retail Trader data can affect sentiment and price action.
| Change in | Longs | Shorts | OI |
| Daily | -3% | 6% | 1% |
| Weekly | -6% | -2% | -4% |
What is your view on Gold – bullish or bearish?? You can let us know via the form at the end of this piece or you can contact the author via Twitter @nickcawley1.