Article by IG Senior Market Analyst Axel Rudolph
FTSE 100, DAX 40, And Nasdaq 100 Analysis and Charts
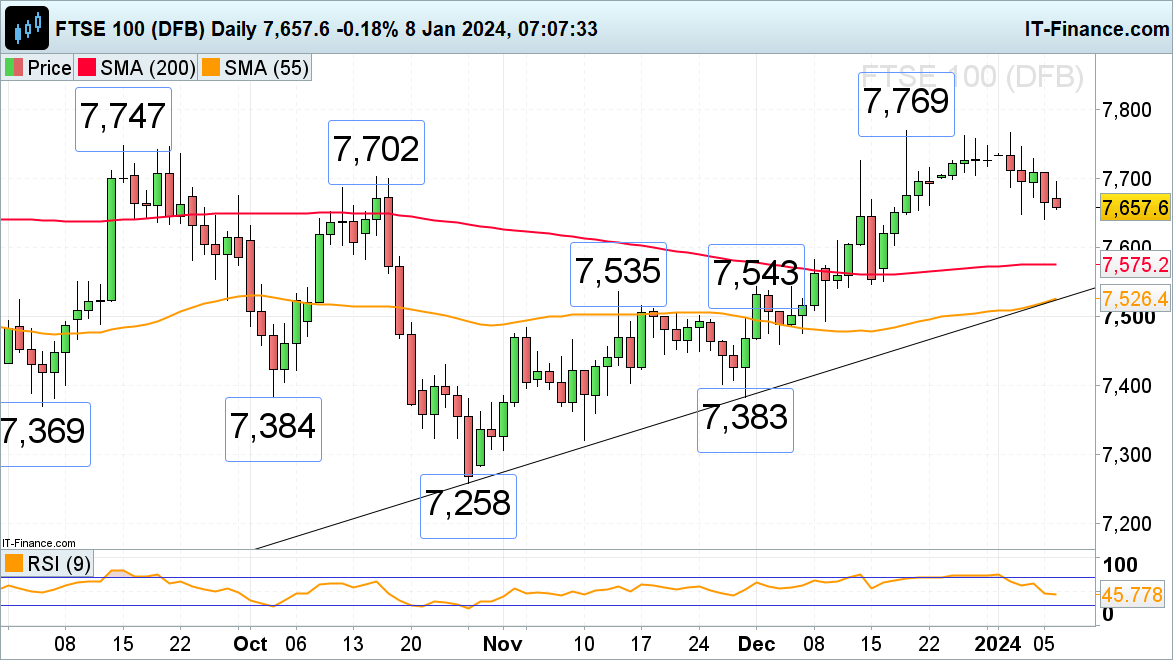
FTSE 100 to open lower as Asian markets decline
The FTSE 100 continues to decline amid pared back rate cut expectations and nears its current 7,648 to 7,641 January lows which may offer support.
While this is the case, Monday’s intraday high at 7,696 may be revisited, a rise above which would put the mid-December high at 7,725 back on the map. Downside pressure should be maintained while this level isn’t being exceeded. Above it lies resistance between the September and December highs at 7,747 to 7,769.
A fall through the 7,648 to 7,641 support zone could lead to the mid-October low at 7,584 being reached, together with the 200-day simple moving average (SMA) at 7,575.
FTSE 100 Daily Chart
Recommended by IG
Building Confidence in Trading
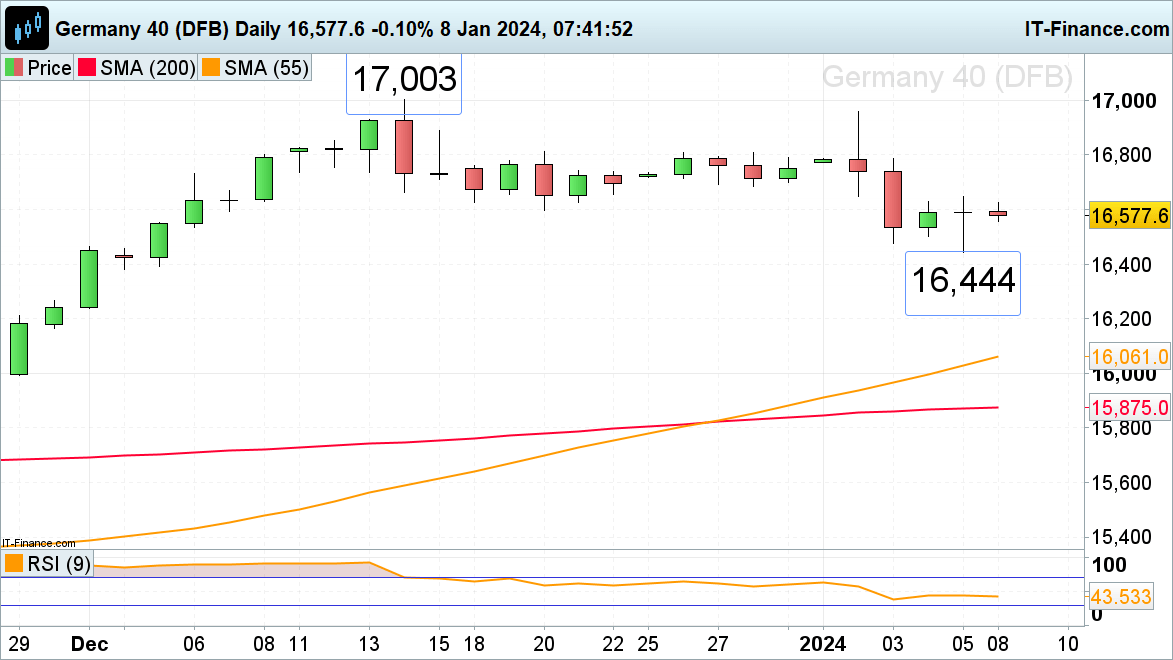
DAX 40 tries to stem decline
The DAX 40 index initially slid to 16,444 on Friday following a Eurozone’s inflation reading, which rose to 2.9% year-on-year (primarily due to the removal of energy aids in some countries), and as US nonfarm payrolls came in stronger than expected, before recovering. They did so as the eleventh month out of twelve showed that numbers had been revised lower and that the employment number fell, re-igniting hopes for more significant rate cuts and leading to US equity indices rising.
The DAX 40 needs to overcome Friday’s Dragonfly Doji high at 16,648 for an interim bottom to be formed. In this case, recent highs at 16,809 to 16,812 could be reached this week. If exceeded, the December record high at 17,003 may be back in focus as well.
Support can be spotted at Wednesday and Thursday’s lows at 16,500 to 16,477 ahead of last week’s low at 16,444.
DAX 40 Daily Chart
| Change in | Longs | Shorts | OI |
| Daily | 17% | 17% | 17% |
| Weekly | 44% | 4% | 10% |
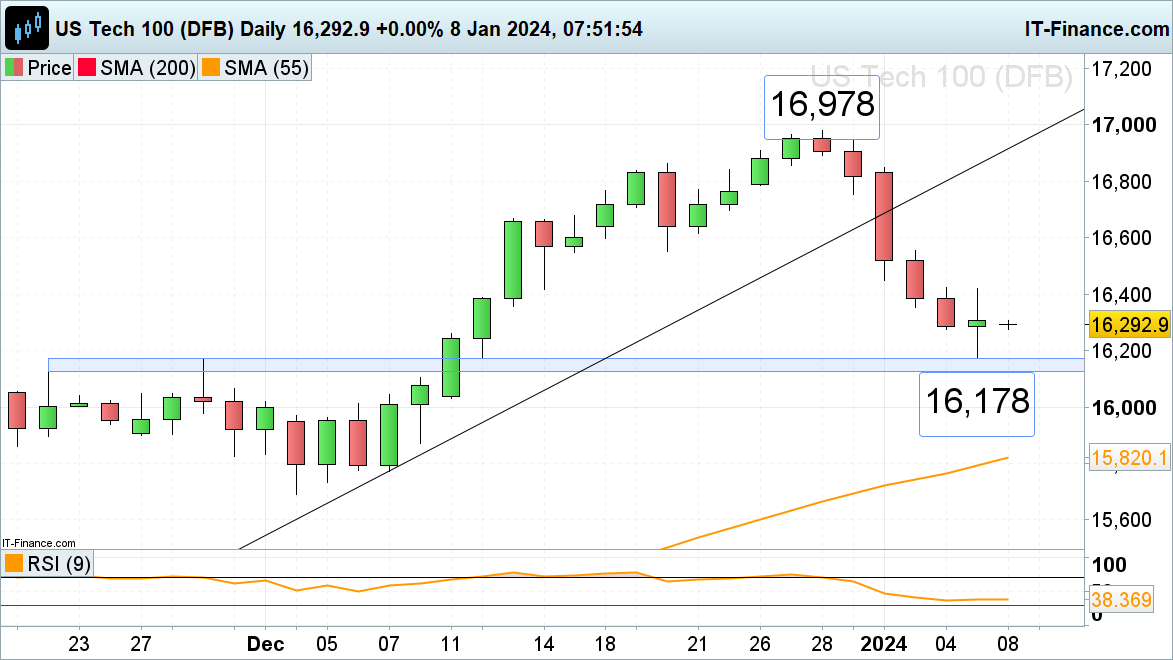
Nasdaq 100 hovers above last week’s low
The Nasdaq 100’s decline at the beginning of this year on lowered rate cut expectations and general risk-off sentiment due to heightened tensions in the Middle East led to a significant drop of around 3.5% and the index hitting a near one-month low at 16,178. It was made close to the 22 and 29 November highs at 16,167 to 16,126 which are expected to offer support, if tested.
A rise above Friday’s high at 16,420 is needed, for a bullish move to gain traction. In this case, the 20 December low at 16,552 would be back in sight.
Nasdaq 100 Daily Chart