
[ad_1]
Crude Oil, WTI, Fed Pivot Bets, CPI Report – Talking Points:
- Crude oil extends losses during Tuesday Asia-Pacific trading session
- Market uncertainty may be pushed further with traders eyeing US CPI
- Another sticker print could reinvigorate hawkish Fed policy estimates
Recommended by Daniel Dubrovsky
How to Trade Oil
WTI crude oil prices fell 2.55% on Monday as market volatility remained elevated in the fallout of last week’s collapse of Silicon Valley Bank. Since last Wednesday, the commodity is down about 3.3%.
Sentiment-linked crude oil was and may continue to remain vulnerable in the coming days/weeks/months as traders assess the likelihood of the United States economy entering a recession. Despite steps taken by the government to shore up confidence in the banking system, investors punished regional bank stocks on Monday.
However, a closer glance reveals that the market reaction on Monday seems to place much more emphasis on expectations of a Federal Reserve pivot than worries about a recession (for now). In fact, traders have priced in about 150 basis points in rate cuts by the Fall of this year. In response, the haven-linked US Dollar sank, and traders piled into tech stocks. The Nasdaq 100 outperformed the Dow Jones.
During Tuesday’s Asia-Pacific trading session, sentiment woes continued deteriorating crude oil prices, with WTI falling almost 1.25% by 3 GMT.
Over the remaining 24 hours, market uncertainty could be pushed further. All eyes are on the 12:30 GMT US CPI report. In February, inflation is seen slowing further to 6.0% y/y from 6.4%. As a reminder, January’s print was stickier than anticipated. Another surprisingly strong print could bring back Fed rate hike expectations, placing crude oil at risk.
Crude Oil Technical Analysis – Daily Chart
On the daily chart, crude oil is fast approaching the floor of a Bearish Rectangle chart formation. The price seems to be around 72.27. However, immediately below is the December low at 70.10 – 71.13. Confirming a breakout under the latter exposes lows from May 2021.
Trade Smarter – Sign up for the DailyFX Newsletter
Receive timely and compelling market commentary from the DailyFX team
Subscribe to Newsletter
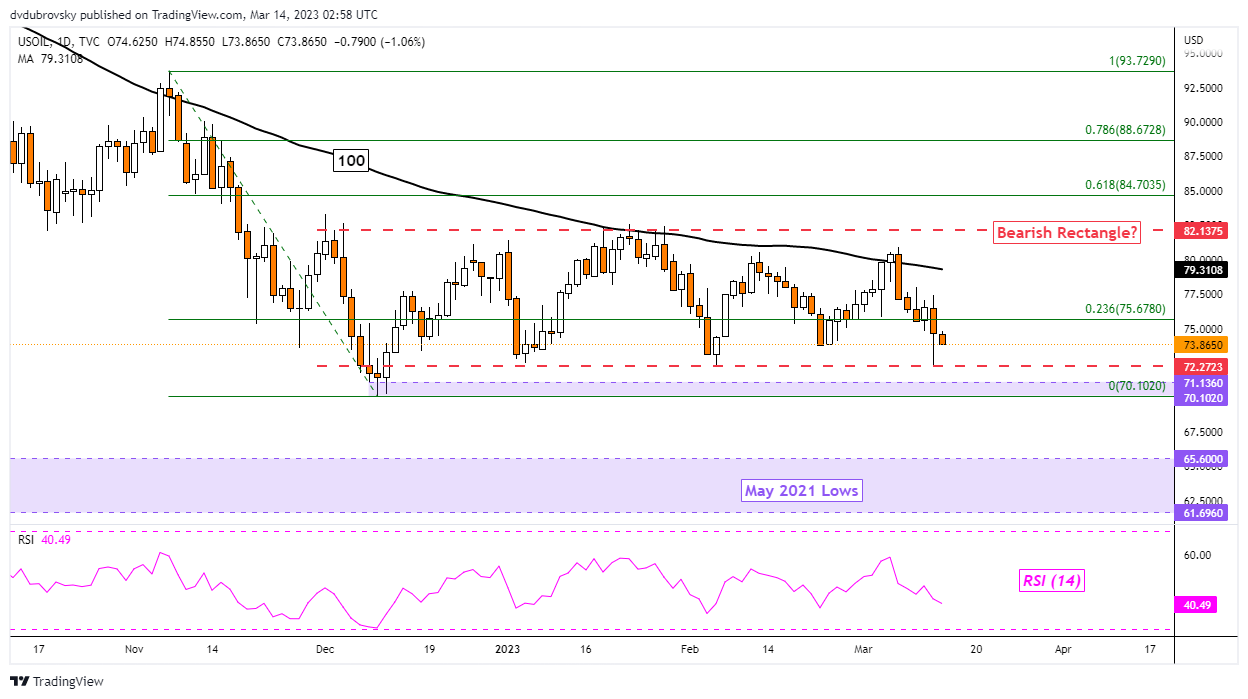
Chart Created Using TradingView
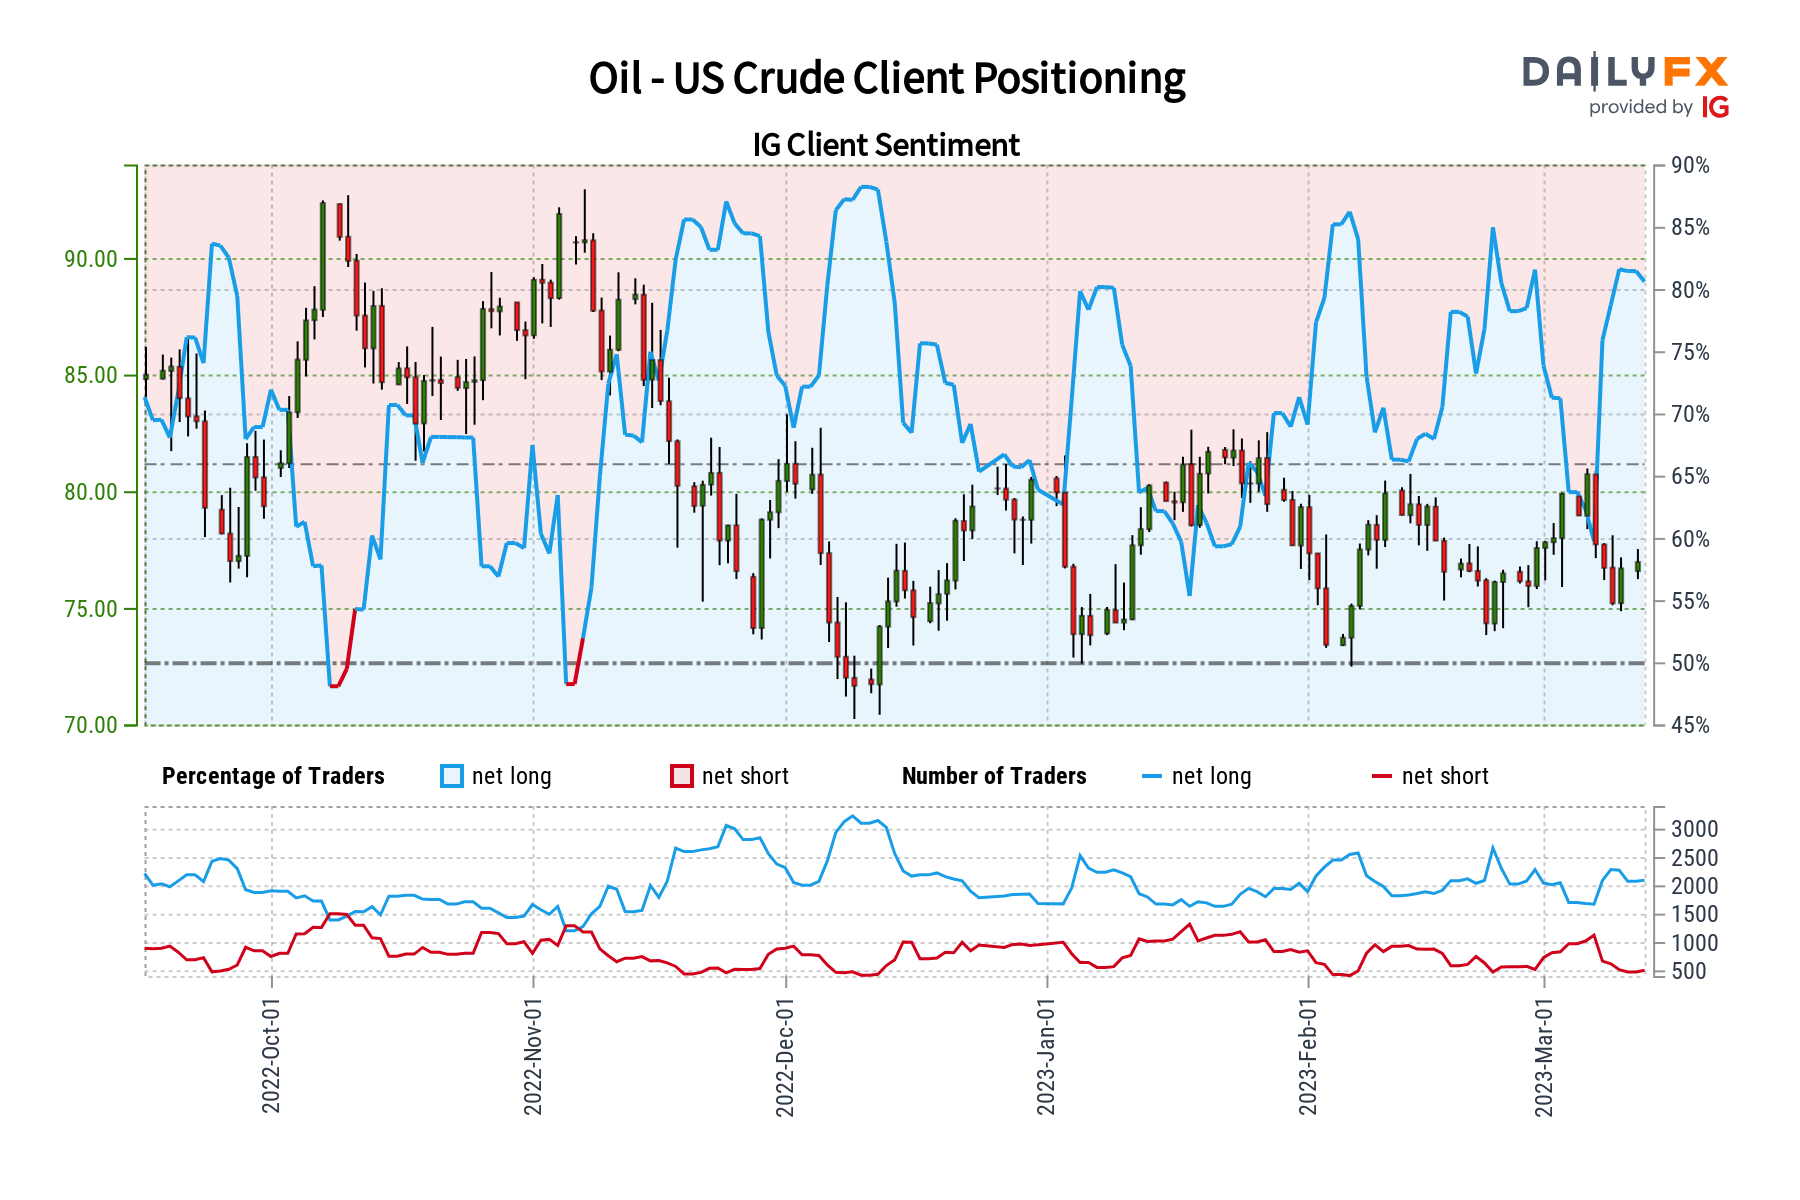
Crude Oil Sentiment Analysis – Bearish
Looking at IG Client Sentiment (IGCS), which tends to be a contrarian indicator, about 82.78% of retail traders are net-long crude oil. Since most of them are biased to the upside, this hints that prices may continue falling. Meanwhile, upside exposure increased by 9.56% and 30.63%, respectively. With that in mind, the combination of overall positioning and recent changes in exposure offers a stronger bearish bias.
— Written by Daniel Dubrovsky, Senior Strategist for DailyFX.com
To contact Daniel, follow him on Twitter:@ddubrovskyFX
[ad_2]