Dow, VIX , Dollar and Macro Economic Event Risk Talking Points:
- The Market Perspective: EURUSD Bearish Below 1.08; USDJPY Bullish Above 133; Dow Bearish Below 33,200
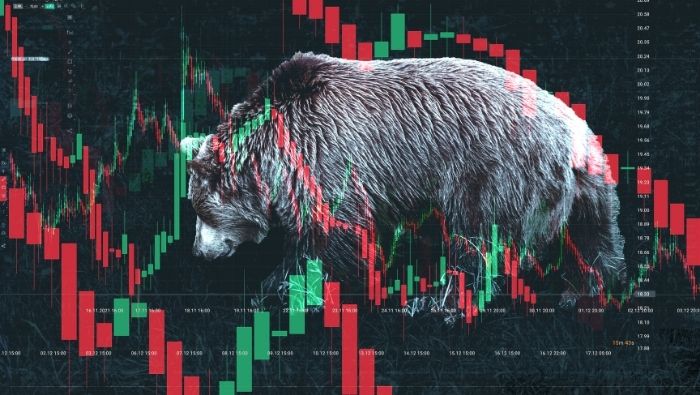
- The US markets reopened after an extended holiday weekend Tuesday, and risk aversion seemed to immediately catch with the Dow presenting a key break and the VIX soaring
- Despite the intensity of the ‘risk off’, there wasn’t a very clear catalyst for the move and the lack of response from the safe haven Dollar raises some important questions
Recommended by John Kicklighter
Trading Forex News: The Strategy
The US markets reopened Tuesday after an extended holiday weekend to unmistakable risk aversion. What is remarkable is that the sense of fear that we would eventually see through the New York trading hours of this past session wasn’t prominent in the preceding sessions and certainly not Monday’s trading session. In fact, one of the most prominent international performances to start the week was from the Chinese-based Shanghai Composite which posted its biggest single-day rally (approximately 2 percent) in nearly three months. I always take into consideration motivation when evaluating markets. It isn’t always necessary to have a singular driver for sentiment to establish a productive trend, but it is a very common feature of momentum-oriented landscapes.
As I assess the conviction of the markets, it is hard to overlook the strong risk aversion experienced through this the Tuesday US session. While there were numerous asset classes reflecting the pressure, the US indices were the most prominently displayed for international investors. All of the major equity measures I follow regularly offered up significant declines from the broad S&P 500 to the small cap Russell 2000 to the speculators’ favorite Nasdaq 100. That said, the most technically-relevant development in my book is the break from the Dow Jones Industrial Average. This blue chip index has avoided much of the errant volatility that we’ve seen recently that in turn has produced false breaks. What is left is months of congestion that turned into three weeks of the smallest trading range since June 2021. The -2.1 percent tumble this past session cleared out that range, the 50-day moving average and the lower bound of the larger wedge from the past three months.
| Change in | Longs | Shorts | OI |
| Daily | 44% | -19% | 8% |
| Weekly | 88% | -27% | 11% |
Chart of Dow Jones Industrial Average with 50 and 100-Day SMAs, 1-Day Rate of Change (Daily)
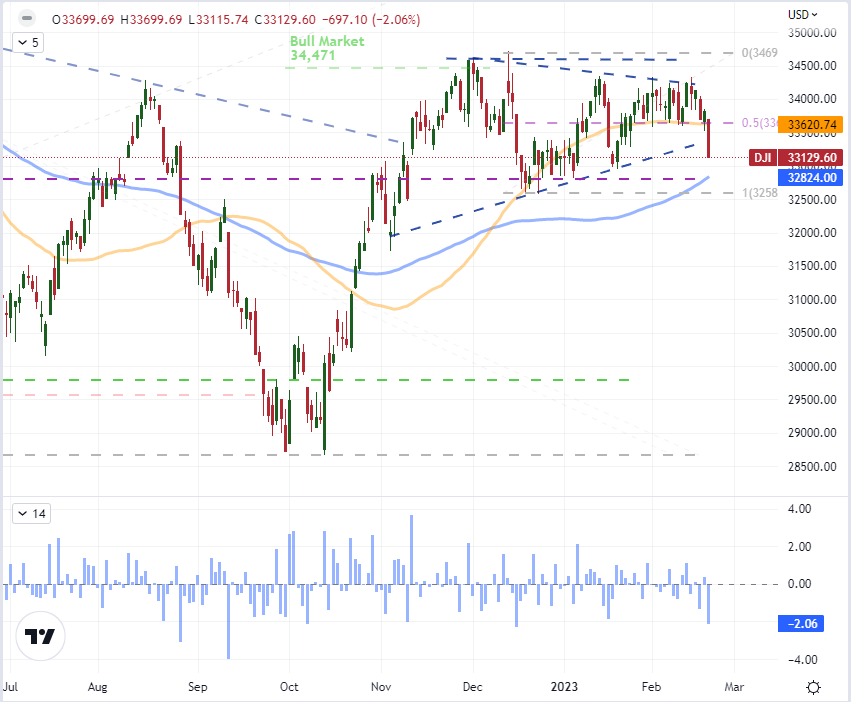
Chart Created on Tradingview Platform
Looking at another measure of market activity, the VIX volatility index would finally show serious signs of life Tuesday. The index charged 2.9 handles higher (over 14 percent), through the day. That is the biggest jump in percentage terms since August 26th – the liftoff stage of the S&P 500’s last substantial leg lower. This measure, like the Dow, has been particularly reticent to throw in with sentiment moves that have not been backed by serious sources of conviction towards risk aversion. There is a natural ‘revision to the mean’ force on measures like implied volatility, and the VIX is rising off lows that are relative extremes to the past year. Further back, there are significantly deeper lows; and we are far from the extremes on the opposite end of the spectrum – which I believe to be closer to the 50 mark. Yet, this reflects a healthy appreciation that markets can still move significantly and unpredictable. That said, a responsive market does not necessarily compensate for a lack of a systemic fundamental driver. If ‘fear’ is going to play fully take the wheel on a sustained market move, a significant escalation is necessary.
Chart of VIX Volatility Index with 50 and 100-day SMAs and 1-Day Rate of Change (Daily)
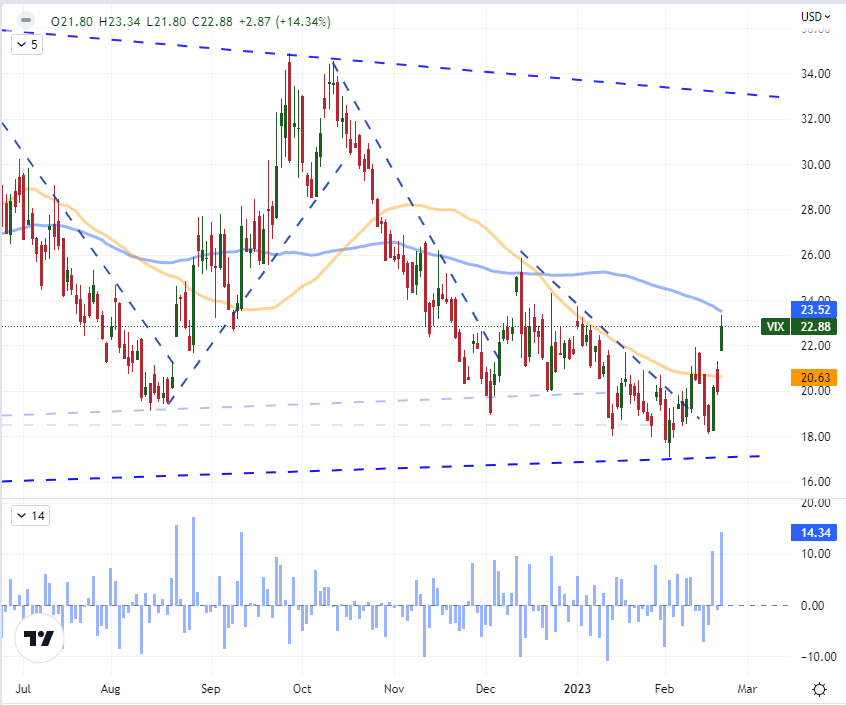
Chart Created on Tradingview Platform
One remarkable distinction in the distribution of risk trends across the market – unrelated to closure of certain regions – was the lack of responsiveness from certain key safe havens. With a strong drop in risk-leaning benchmarks like the US equity indices, I would expect a haven like the US Dollar to benefit. The correlation between the currency and activity measure is a health 0.60 over the past 20 days (strong and positive) and 0.71 over the past three months or 60 days. Nevertheless, the DXY Dollar Index responded to swell in presumed fear with a meager 0.41 point climb. That wouldn’t clear Friday’s peak high much less revive the nascent bull trend attempted this past week. What makes the Greenback’s lack of traction even more surprising is that the US 2-year yield, which is a reflection of interest rate expectations, as also pushing a new multi-year high through the day. Whether a response to Fed speak, the Cleveland Fed research report or general economic data; there was a distinct disconnect from the Dollar. This is another fundamental red flag for the conviction on risk trends. I would expect either risk appetite to capitulate to the currency’s skepticism or the USD to find its safe haven bid.
Chart of DXY Dollar Index with 100-Day SMA Overlaid with US 2-Year Yield (Daily)
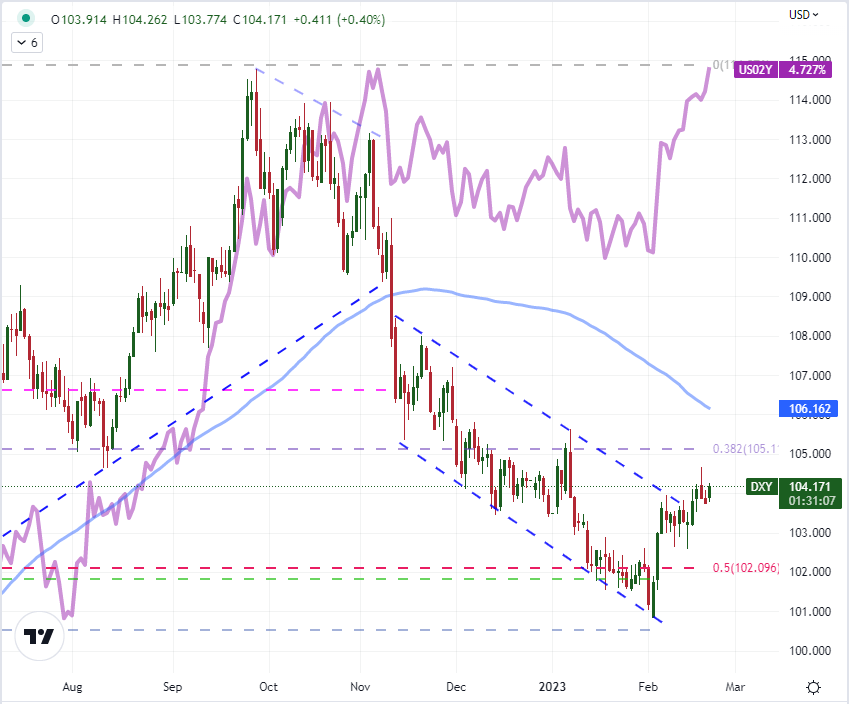
Chart Created on Tradingview Platform
Looking ahead to the next 24 hours of macroeconomic event risk, there are a few highlights of serious prominence but nothing that I would consider to be systemically capable. For a Dollar and monetary policy impression, we have a little Fed speak; but many will be combing through the FOMC minutes to see if there is any insight as to how the central bank will be swayed in its views at the next central bank rate decision. There has been a swing in market expectations relative to the Fed’s own views, and this requires significant support to maintain its speculative force. Ultimately, I believe the PCE deflator – the Fed’s favorite inflation reading – will carry more weight in this fundamental field. For more targeted but acute monetary policy influence, the RBNZ rate decision in the Asian session is a capable Kiwi Dollar driver – just don’t expect its outcome to leach back into the global market.
Top Global Macro Economic Event Risk for Next 24 Hours
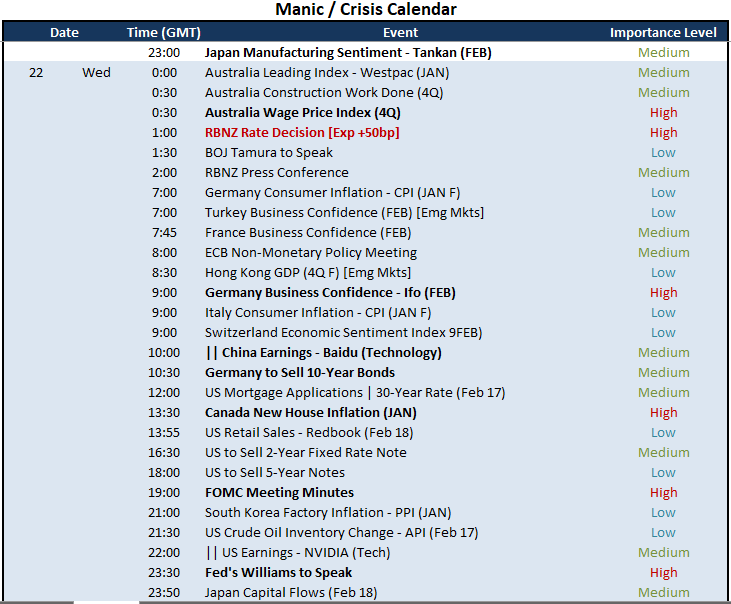
Calendar Created by John Kicklighter

Discover what kind of forex trader you are