GBP/USD – Prices, Charts, and Analysis
- UK growth flatlines in February, January was revised higher.
- GBP/USD nears a fresh multi-month high.
Recommended by Nick Cawley
Get Your Free GBP Forecast
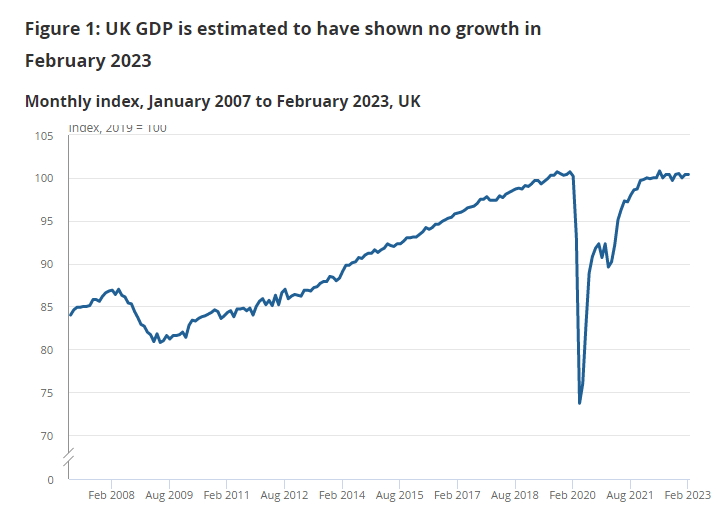
The UK economy stood still in February as industrial action in various areas of the services sector contributed to UK growth flatlining. The latest Office for National Statistics (ONS) monthly GDP data showed no growth in February with the services sector falling by 0.1% compared to a revised higher 0.7% growth in January. According to the ONS, ‘the largest contributions to the fall in services output in February 2023 came from education and public administration and defence: compulsory social security, industrial action took place in both of these industries in February 2023’.

According to the ONS, monthly GDP is now estimated to be 0.3% above its pre-coronavirus levels in February 2020.
GBP/USD is getting a small lift from today’s UK data and from a marginally weaker US dollar. The greenback fell yesterday after US headline inflation fell for the ninth month in a row to 5%, vs expectations of 5.2%. While inflation slowly falls, the US economy may enter a mild recession, according to yesterday’s FOMC minutes. According to the report, the recent banking crisis may push the economy into a mild recession later in the year due to tighter bank lending conditions. While this will slowdown economic activity, it will also weigh on inflation.
US Dollar Extends Losses as Fed Minutes Flag Recession Risks amid Banking Sector Turmoil
GBP/USD is now testing 1.2500 again and a break higher will see 1.2525 come into play. Above here May 27, 2022 swing high at 1.2667 becomes the next level of interest. Initial support is seen at 1.2448, a prior level of resistance, before the 20-day moving average at 1.2355.
GBP/USD Daily Price Chart – April 13, 2023
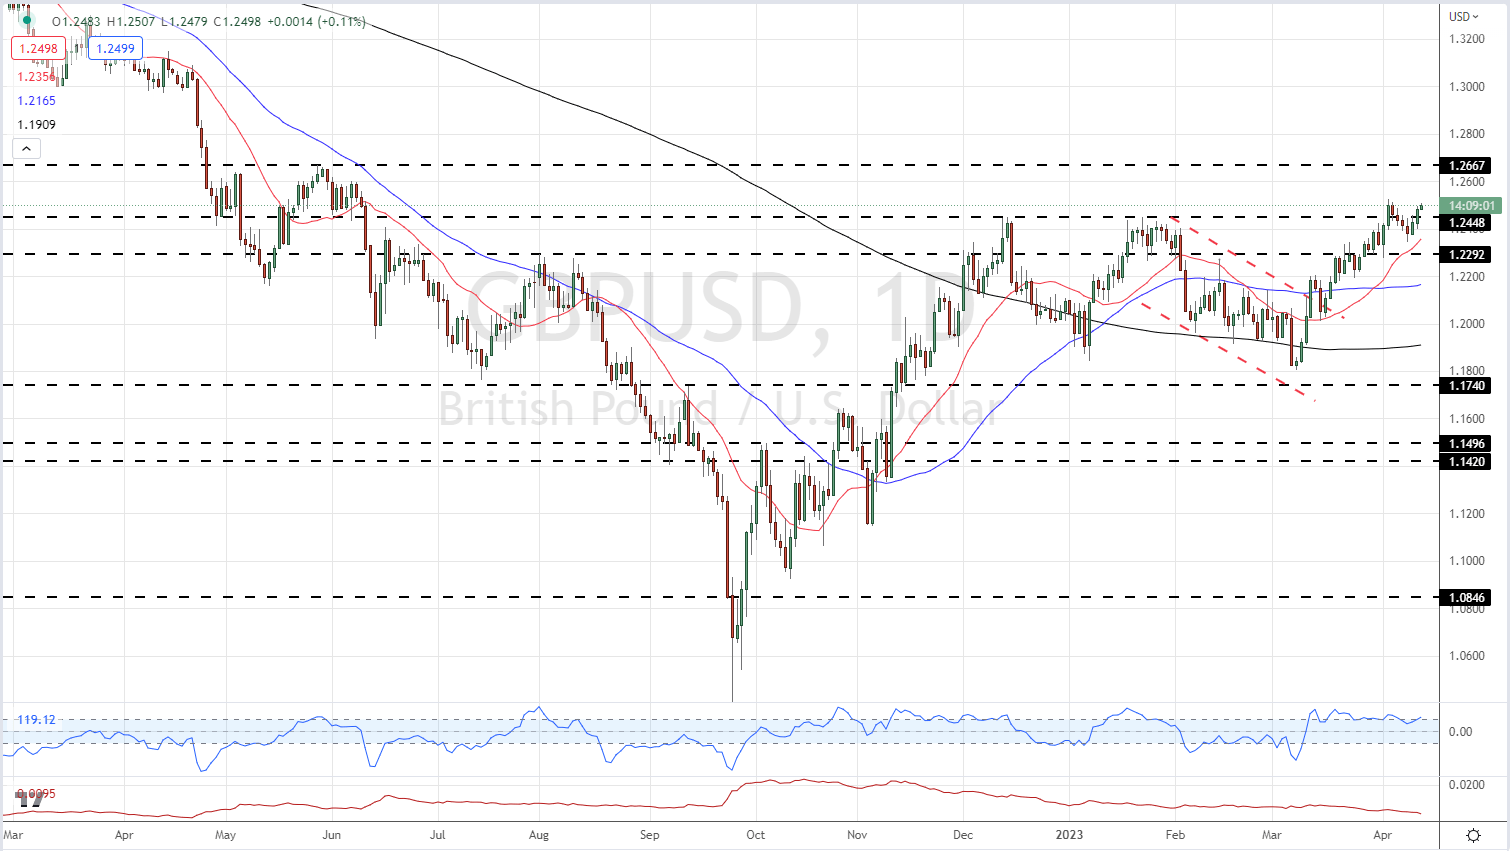
Chart via TradingView
| Change in | Longs | Shorts | OI |
| Daily | -12% | 13% | 2% |
| Weekly | 0% | -1% | 0% |
Retail Sentiment is Mixed
Retail trader data show 39.60% of traders are net-long with the ratio of traders short to long at 1.53 to 1.The number of traders net-long is 12.06% lower than yesterday and 4.17% higher than last week, while the number of traders net-short is 10.30% higher than yesterday and 3.66% lower than last week.
We typically take a contrarian view to crowd sentiment, and the fact traders are net-short suggests GBP/USD prices may continue to rise. Positioning is more net-short than yesterday but less net-short from last week. The combination of current sentiment and recent changes gives us a further mixed GBP/USD trading bias.
What is your view on the GBP/USD – bullish or bearish?? You can let us know via the form at the end of this piece or you can contact the author via Twitter @nickcawley1.