Most Read: Gold, Silver Price Forecast – XAU/USD & XAG/USD May Get Boost from Macro Trends
The U.S. dollar, as measured by the DXY index, was a tad firmer on Wednesday, extending its rebound for the third day in a row after last week’s overextended selloff in the wake of the FOMC decision and softer-than- expected data. Gains on the session were likely driven by the sour mood on Wall Street, with U.S. equity indices losing ground and ending a multi-day winning streak.
In this article, we’ll focus on EUR/USD, USD/MXN and USD/CAD from a technical perspective, taking into account price action dynamics and market sentiment.
Curious about the expected path for EUR/USD and the market catalysts that should be on your radar? Explore all the details in our Q4 euro trading forecast. Download it now!
Recommended by Diego Colman
Get Your Free EUR Forecast
EUR/USD TECHNICAL ANALYSIS
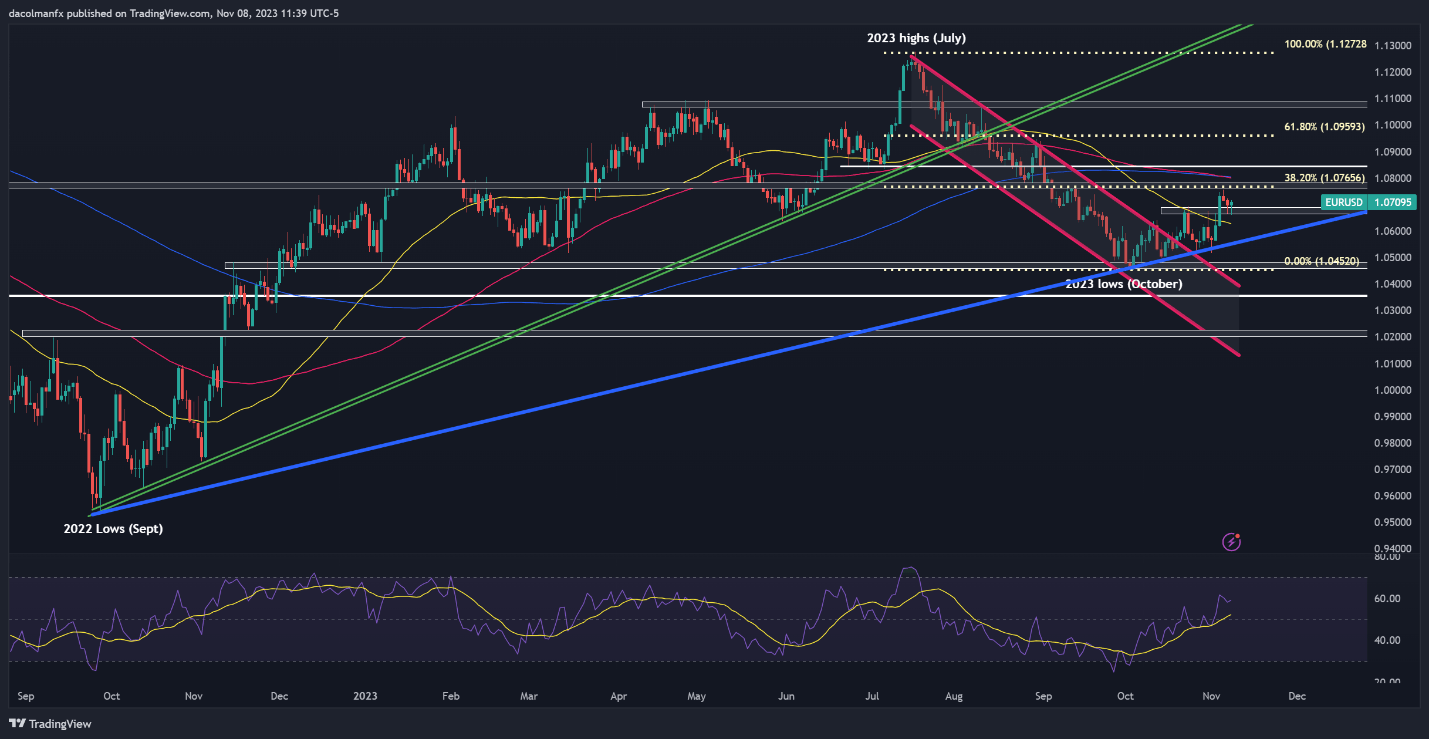
EUR/USD has retreated over the last couple of days after failing to take out Fibonacci resistance at 1.0765 earlier in the week. However, the pair has managed to establish a base around the 1.0700 handle and has started to perk up, signaling that the selling pressure is abating. If the rebound extends in the coming sessions, the initial ceiling to watch lies at 1.0765. On further strength, attention shifts to 1.0840.
In the event that sellers return and trigger a bearish reversal, the first layer of defense against bearish attacks can be found within the range of 1.0695 to 1.0670. A violation of this key floor could accelerate losses for the pair, setting the stage for a retest of this year’s lows at 1.0450. On continued downward pressure, focus will be locked onto 1.0355.
EUR/USD TECHNICAL CHART
EUR/USD Chart Created Using Trading View
If you are discouraged by trading losses, why not take a proactively positive step towards improvement? Download our guide, “Traits of Successful Traders,” and access invaluable insights to assist you in avoiding common trading errors.
Recommended by Diego Colman
Traits of Successful Traders
USD/MXN TECHNICAL ANALYSIS
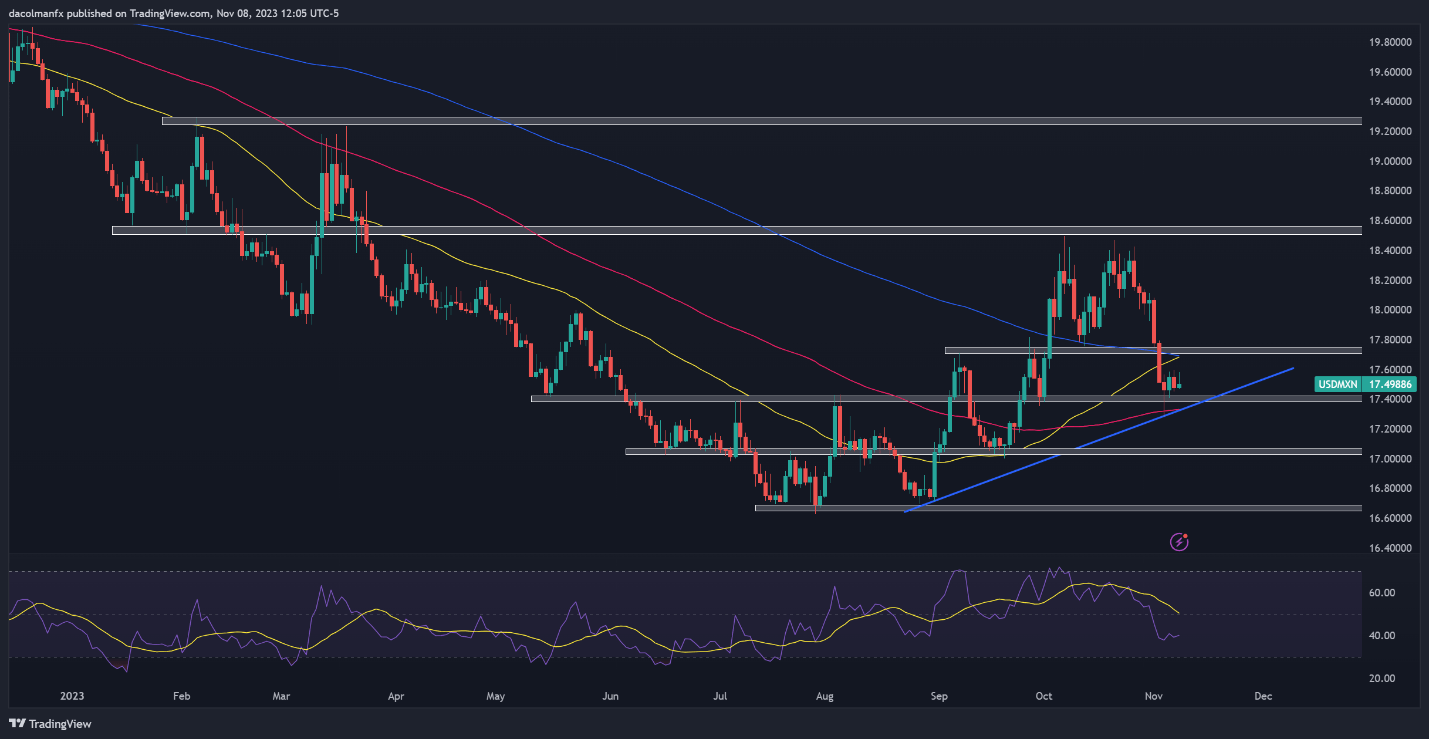
The recent manifestation of risk-on sentiment has worked to the advantage of the Mexican peso, allowing USD/MXN to retreat from its October highs, as seen in the daily chart below. If the pair continues on its bearish course, support is positioned around the 17.40 mark. Sellers may find it challenging to breach this technical floor, but in the case of a breakdown, a potential move to 17.05 is conceivable.
On the contrary, if the market mood deteriorates and USD/MXN resumes its climb, overhead technical resistance stretches from 17.70 to 17.75, a key ceiling area where the 200-day simple moving average converges with several recent swing highs. On further strength, we could potentially witness a rally towards the 18.50 area.
USD/MXN TECHNICAL CHART
USD/MXN Chart Prepared Using TradingView
Discover the power of market sentiment. Download the sentiment guide to understand how USD/CAD positioning can influence the underlying trend!
| Change in | Longs | Shorts | OI |
| Daily | -1% | 18% | 11% |
| Weekly | 35% | -13% | -3% |
USD/CAD TECHNICAL ANALYSIS
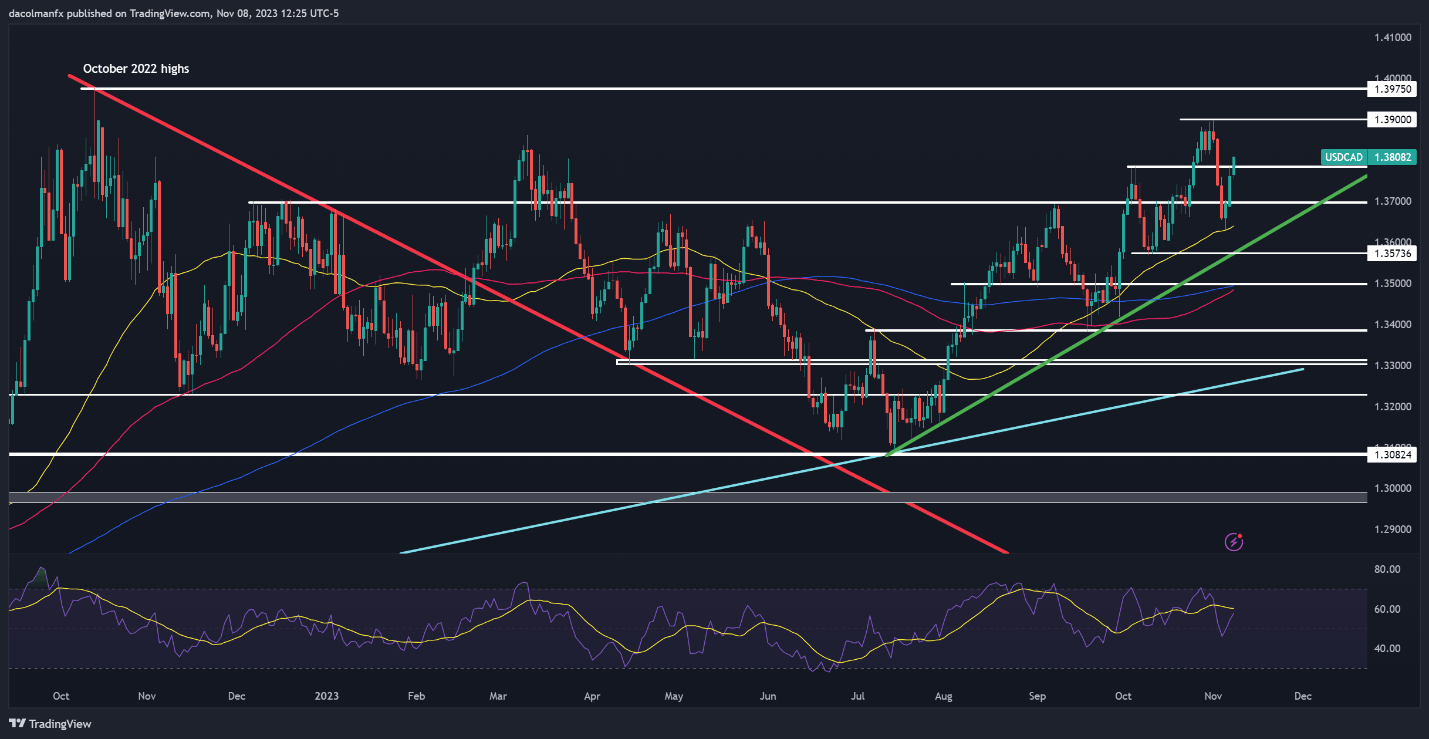
USD/CAD has rallied in recent days after finding solid support around the 50-day simple moving average earlier in the week. The bullish move has been reinforced by the sharp drop in oil prices, which represents a key commodity for the Canadian economy, with the pair taking out resistance at 1.3785. If gains accelerate in the coming sessions, attention will be on the 1.3900 handle, followed by 1.3975.
In the event that the market turns, and sentiment shifts in favor of sellers, technical support levels are identifiable at 1.3785 and 1.3700. With continued weakness, the possibility of a retest of the 50-day SMA comes into view. Should the price fall below this moving average, trendline support at 1.3575 warrants a watchful eye.


