
Gold Price (XAU/USD), Chart, and Analysis
- The August 2020 record high at $2,075/oz. is under threat.
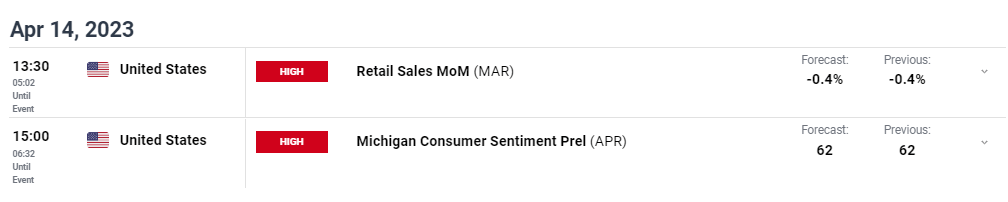
- US retail sales and Michigan consumer sentiment are released later.
Recommended by Nick Cawley
Get Your Free Gold Forecast
Most Read: Gold Could Test a Multi-Month High if a Bullish Technical Pattern Plays Out
US dollar weakness and a growing realization that US interest rates have either peaked or are very close to their pinnacle continue to drive gold ever higher. A fresh all-time high is within reach and this will likely draw additional attention to the precious metal.
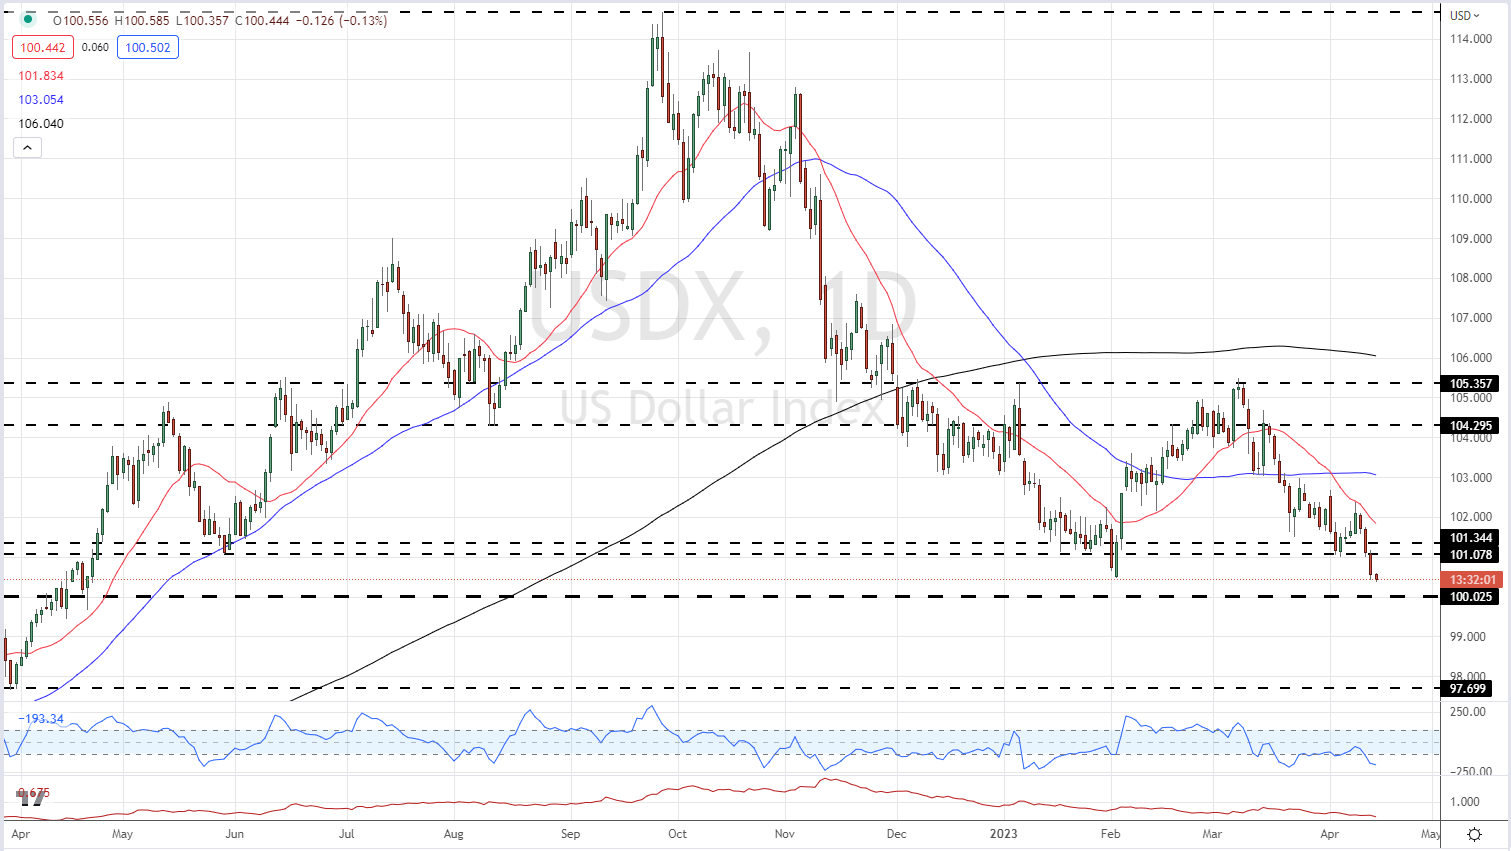
The US dollar is under pressure as traders continue to price in interest rate cut probabilities for later this year. The current Fed Fund rate of 475-500 is currently seen moving 25bps higher to 500-525 at the May FOMC meeting, staying at that level in June before rate cuts start in July. The latest CME Fed Fund projections predict that Fed Funds will be at 425-450 by the end of the year. This expected loosening of Fed monetary policy is weighing on the US dollar, especially against other currencies that are still in tightening mode. The Euro is one such currency and ECB chatter continues to suggest that the central bank will continue hiking rates to counter inflation. The Euro accounts for nearly 58% of the US dollar index – a basket of six currencies used to value the US dollar – and with the ECB still in tightening mode, the value of the greenback looks likely to fall further.
US Dollar Index Daily Price Chart – April 14, 2023
Later in today’s session, we have two important US economic releases, retail sales, and Michigan consumer confidence. Retail sales data is an important gauge of high street activity, while the Michigan consumer sentiment report is an important measure of consumer expectations, prospects, and their economic outlook. Both can move the market if expectations are missed or beaten by a margin.
For all market-moving data releases and events, see the DailyFX Economic Calendar
Pennant Patterns: Trading Bearish and Bullish Pennants
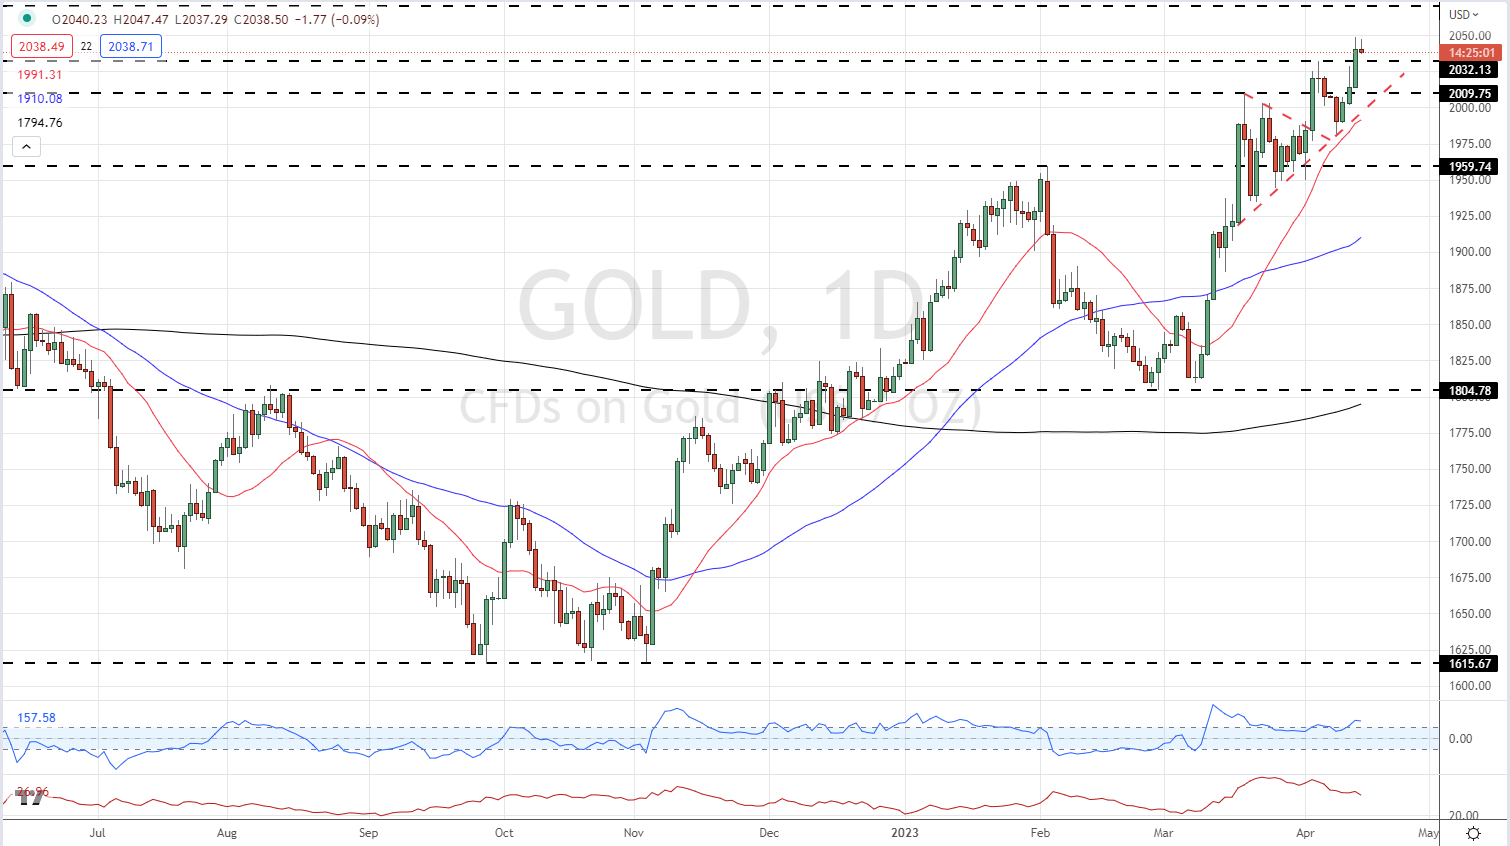
Gold currently changes hands just below $2,040/oz, up nearly $60/oz. from this week’s low print. In recent articles I have noted the formation of a bullish pennant pattern on the daily gold chart and this continues to drive technical price action. If this formation continues, then the all-time high at $2,075/0z. will come under pressure. Short-term support is seen at around $2,032/oz. before $2,009/oz.
Gold Price Daily Chart – April 14, 2023
Charts via TradingView
| Change in | Longs | Shorts | OI |
| Daily | -8% | 18% | 4% |
| Weekly | -2% | 18% | 7% |
Retail Traders Increase Net-Shorts Further
Retail trader data show 49.84% of traders are net-long with the ratio of traders short to long at 1.01 to 1.The number of traders net-long is 8.53% lower than yesterday and 2.54% lower from last week, while the number of traders net-short is 19.11% higher than yesterday and 15.64% higher from last week.
We typically take a contrarian view to crowd sentiment, and the fact traders are net-short suggests Gold prices may continue to rise. Traders are further net-short than yesterday and last week, and the combination of current sentiment and recent changes gives us a stronger Gold-bullish contrarian trading bias.
What is your view on Gold – bullish or bearish?? You can let us know via the form at the end of this piece or you can contact the author via Twitter @nickcawley1.