
US Stocks (SPX, NDX) News and Analysis
S&P 500 Gaps Lower at the Start of US Trading
The S&P 500 started the day on the back foot, gapping lower at the open after what is shaping up to be a tough week for stocks. Hotter-than-expected US data initially posed the challenge for US equities, as markets viewed this as a sign that Powell will be forced to keep rates higher for longer, propping up the dollar and US yields while weighing on riskier stocks.
The index struggled to retest the longer-term trendline resistance and the 2023 high at 4607, trading sharply lower since last week Friday. A close below 4450 this week opens up the index for another retest of the prior level of support all they way at 4325. Markets appear increasingly sensitive to incoming data which is likely to continue considering the Fed is nearing a turning point (peak rates). Next week’s CPI data will be keenly observed as it remains the last piece of the puzzle before the Fed reconvenes on September the 20th. Today, look out for plenty of Fed representatives as they provide their views ahead of the Fed blackout starting Saturday and ending the Thursday after the statement is released.
S&P 500 Daily Chart
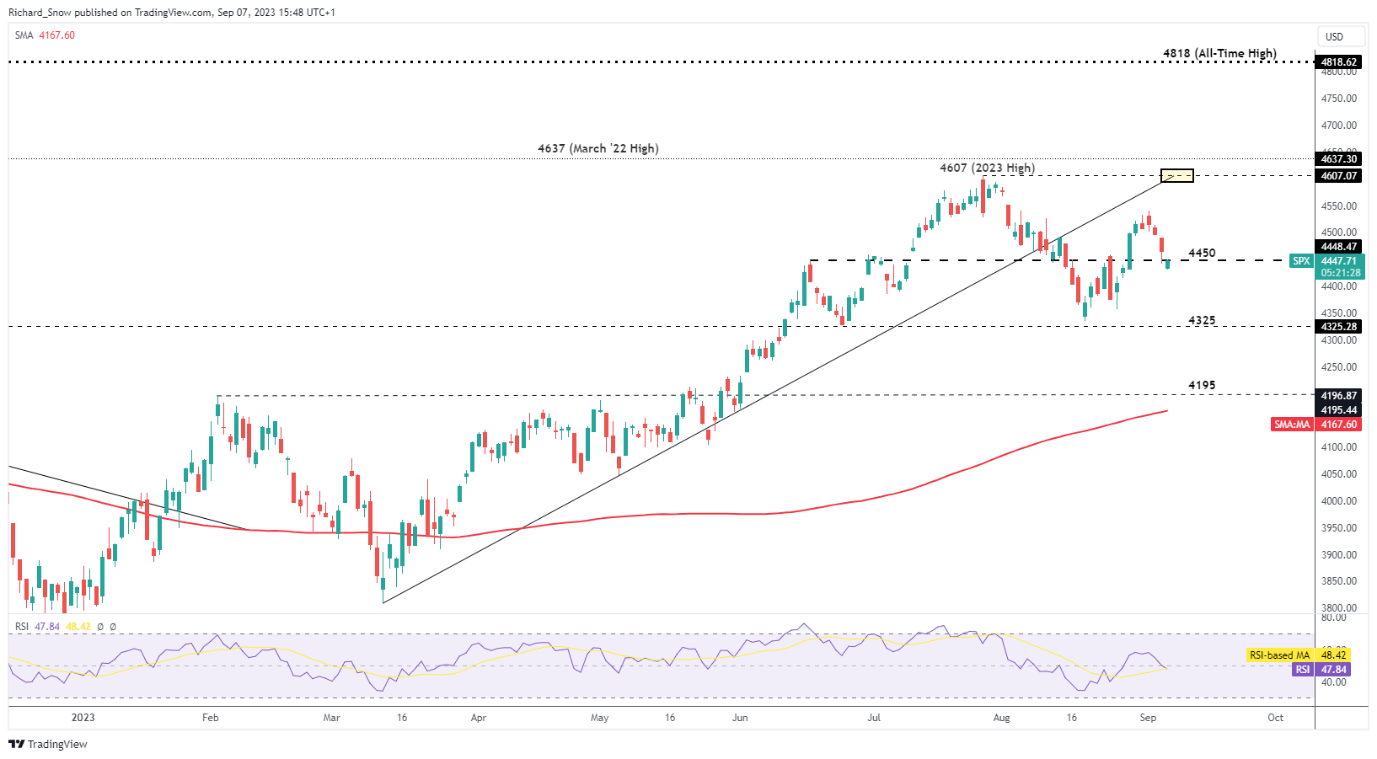
Source: TradingView, prepared by Richard Snow
Recommended by Richard Snow
Traits of Successful Traders
Nasdaq susceptible to tech slide as Apple leads the index lower
Tech stocks showed an increasing susceptibility to changing sentiment within the sector. China’s ban on government use of iPhones and talk of wider bans sent the phone maker’s stock sharply lower, weighing down the rest of the tech sector. Tech stocks are also finding the going tough in light of robust US economic data which threatens to force the Fed’s hand, potentially hiking interest rates one more time before the year is up.
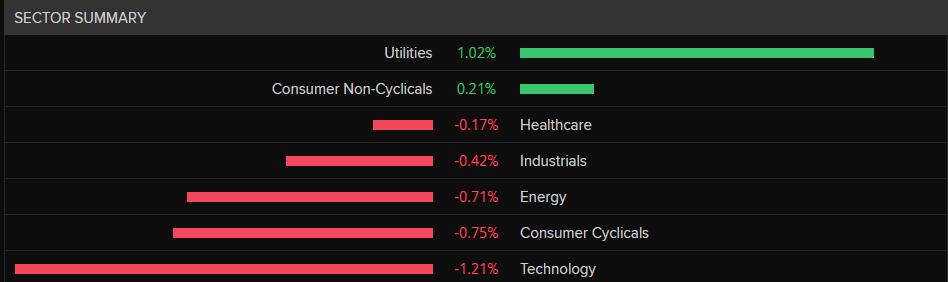
Source: Refinitiv, prepared by Richard Snow
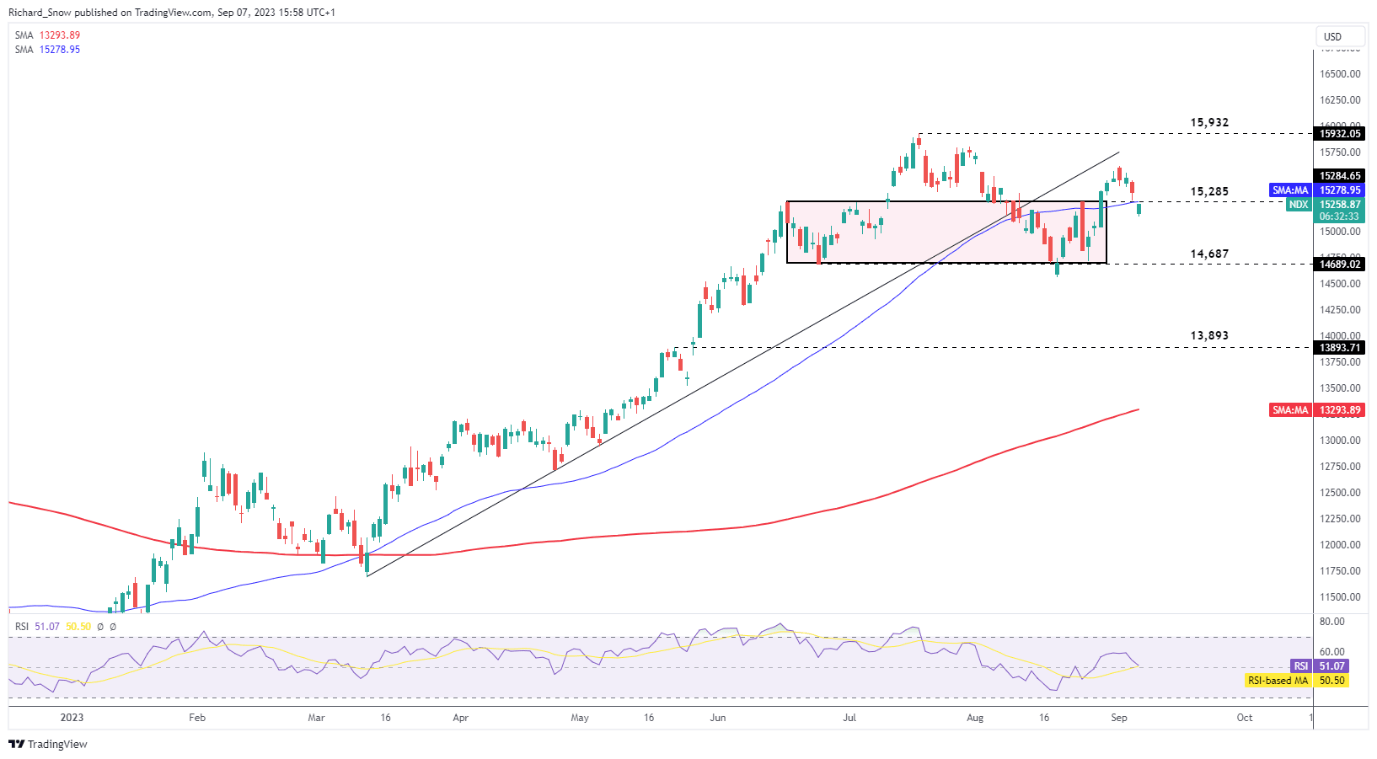
The Nasdaq daily chart reveals the recent bearish direction after failing to retest the longer-term trendline (prior support, now resistance). The index gapped through the 50 day simple moving average to start the day on a negative note but has risen in the moments thereafter.
14,687 is the next level of support should there be a close below 15,285 and the 50 SMA. However, a close above 15,285 keeps the bullish hope alive and could extend the move that transpired since the 18 August swing low.
Nasdaq 100 Daily Chart Source: TradingView, prepared by Richard Snow
Trade Smarter – Sign up for the DailyFX Newsletter
Receive timely and compelling market commentary from the DailyFX team
Subscribe to Newsletter
— Written by Richard Snow for DailyFX.com
Contact and follow Richard on Twitter: @RichardSnowFX