
This article focuses on the technical outlook for the U.S. dollar index and some of the major FX pairs. If you are interested in reading about the fundamental prospects for the US currency, be sure to request the full Q1 forecast.
Recommended by Diego Colman
Get Your Free USD Forecast
DXY TECHNICAL ANALYSIS
The U.S. dollar, as measured by the DXY index, trekked upwards and climbed to its best level since November 2022 early in the fourth quarter, but then stalled and unexpectedly pivoted lower when prices were unable to decisively overcome confluence resistance near 107.3. This technical rejection paved the way for a prolonged sell-off that extended into late December, as seen in the chart below, sending the greenback to its weakest point in more than four months.
After recent losses, DXY is probing a key support zone ranging from 102.00 to 101.70 – an interval where a major long-term rising trendline aligns with the 50% Fibonacci retracement of the Jan 2021/ Sep 2022 advance. Preserving this floor is vital; a failure to do so might amplify downward pressure, exposing the 100.75 mark. On further weakness, the focus shifts to 99.65, then 99.98, where the 61.8% Fib retracement converges with the 200-week simple moving average and the July swing lows.
In the event of a bullish reversal from current levels, initial resistance is located around the 50-week simple moving average, but additional gains could be in store for the U.S. dollar on a push above this ceiling, with the next area of interest at 104.70. Overcoming this hurdle will pose a formidable challenge for the bulls, but a successful breakout could expose trendline resistance at 105.75. On continued strength, a retest of this year’s high should not be dismissed.
US Dollar (DXY) Weekly Chart
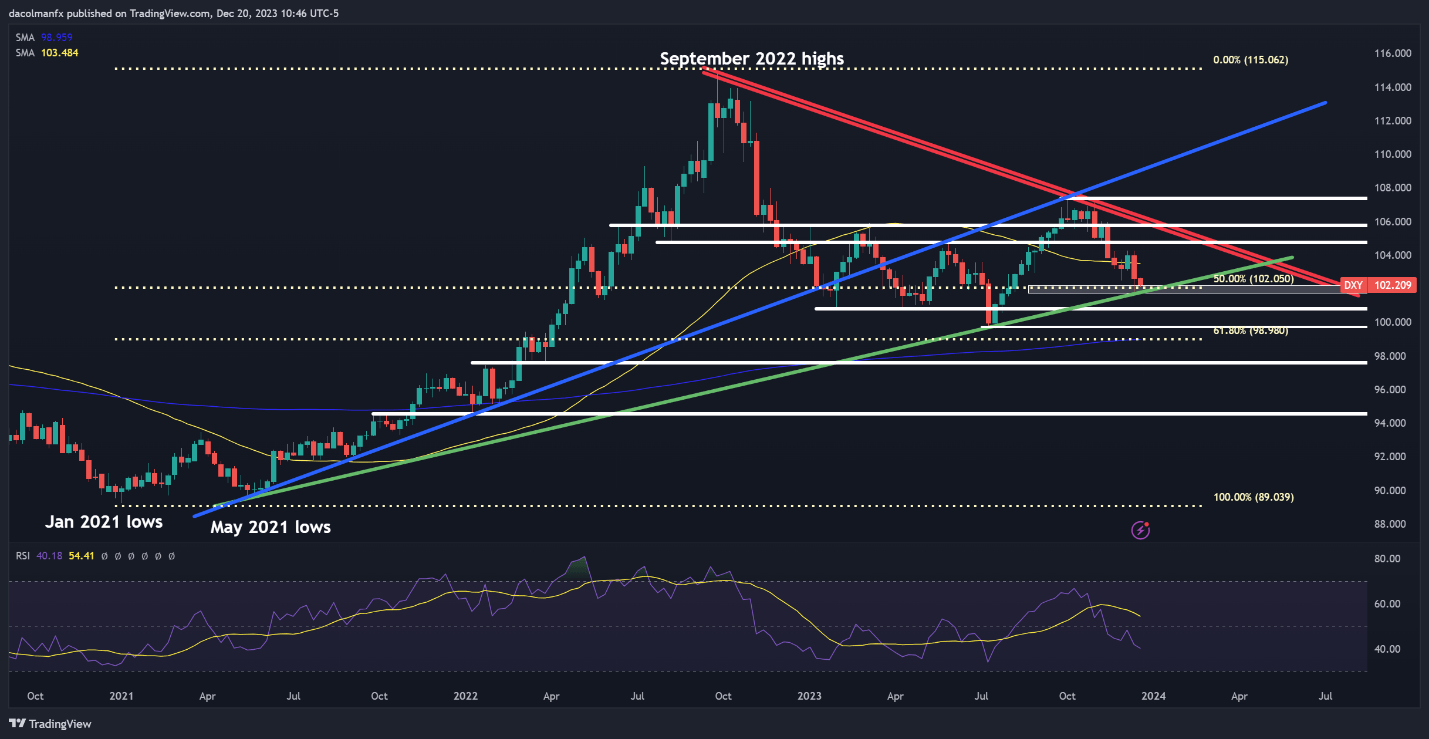
Source: TradingView, Prepared by Diego Colman
Fine-tune your trading skills and stay proactive in your approach. Request the EUR/USD forecast for an in-depth analysis of the euro’s fundamental and technical outlook!
Recommended by Diego Colman
Get Your Free EUR Forecast
EUR/USD TECHNICAL ANALYSIS
After a prolonged sell-off during much of the third quarter, EUR/USD rebounded off trendline support early in the fourth quarter, rallying past its 50-week simple moving average. If bullish momentum is sustained in Q1 2024, which seems a reasonable proposition, resistance lies at 1.1100/1.1150. Successfully piloting above this area will expose 1.1275 – a key ceiling where the 2023 peak aligns with the 61.8% Fib retracement of the 2021/2022 decline. Subsequent gains could lead to a move to 1.1500, followed by 1.1700.
Conversely, if sentiment shifts in favor of sellers and prices head lower, the 50-week SMA will serve as the first line of defense against a bearish assault, followed by confluence support near 1.0630, where a key trendline converges with the 38.2% Fib retracement of the Sep 2022/Jul 2023 climb. Prices may bottom out around these levels on a pullback before staging a comeback, but the chances of a descent towards 1.0425 and later 1.0222 will grow in the case of an unexpected breakdown.
EUR/USD Weekly Chart
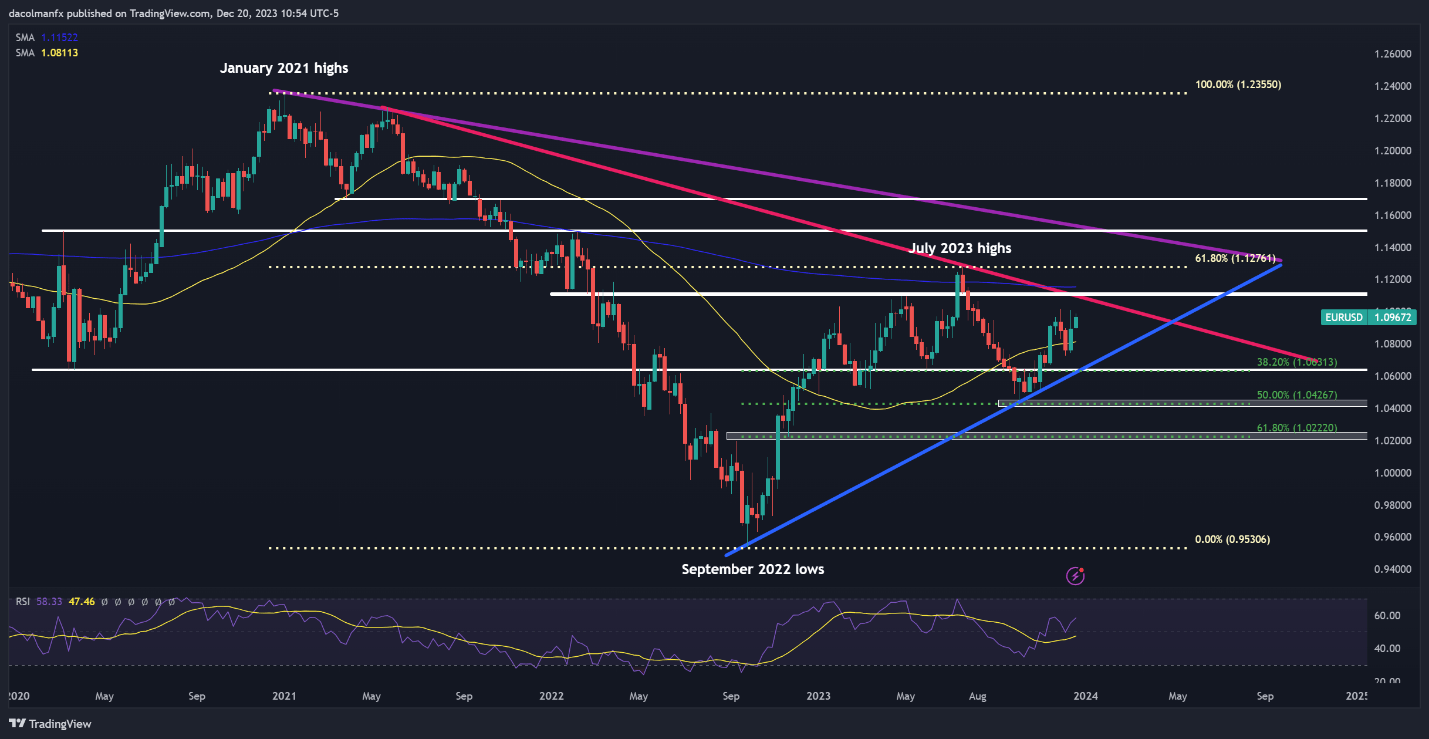
Source: TradingView, Prepared by Diego Colman
Interested in learning how retail positioning can offer clues about USD/JPY’s near-term path? Our sentiment guide has valuable insights about this topic. Download it now!
| Change in | Longs | Shorts | OI |
| Daily | -16% | -11% | -12% |
| Weekly | -25% | 21% | 3% |
USD/JPY TECHNICAL ANALYSIS
USD/JPY retested its 2022 high located near the psychological 152.00 level in the fourth quarter, but failed to breach it, with sellers staunchly defending this technical barrier and ultimately repelling prices lower, as seen in the weekly chart below.
While the pair remains in an uptrend, the underlying bias could become less constructive if the exchange rate dips beneath its 50-week simple moving average at 141.00. In such a scenario, prices could gravitate towards 137.50, followed by 133.20 – a major Fibonacci threshold. USD/JPY may establish a base in this region on a pullback, but a breakdown could usher a move toward trendline support at 130.00. Looking lower, attention turns to 127.33, which represents the 50% retracement of the Jan 2021/Oct 2022 rally.
Shifting our focus to the bullish outlook, if the bears capitulate and buyers reclaim full control of the market, the first line of defense capping the upside is situated at 145.30, with the next subsequent ceiling situated at 148.50. Bulls are likely to encounter staunch resistance in this zone, but a successful breakthrough could drive prices toward the peak observed in 2023. On further strength, all eyes will be on the 15800 handles.
USD/JPY Weekly Chart
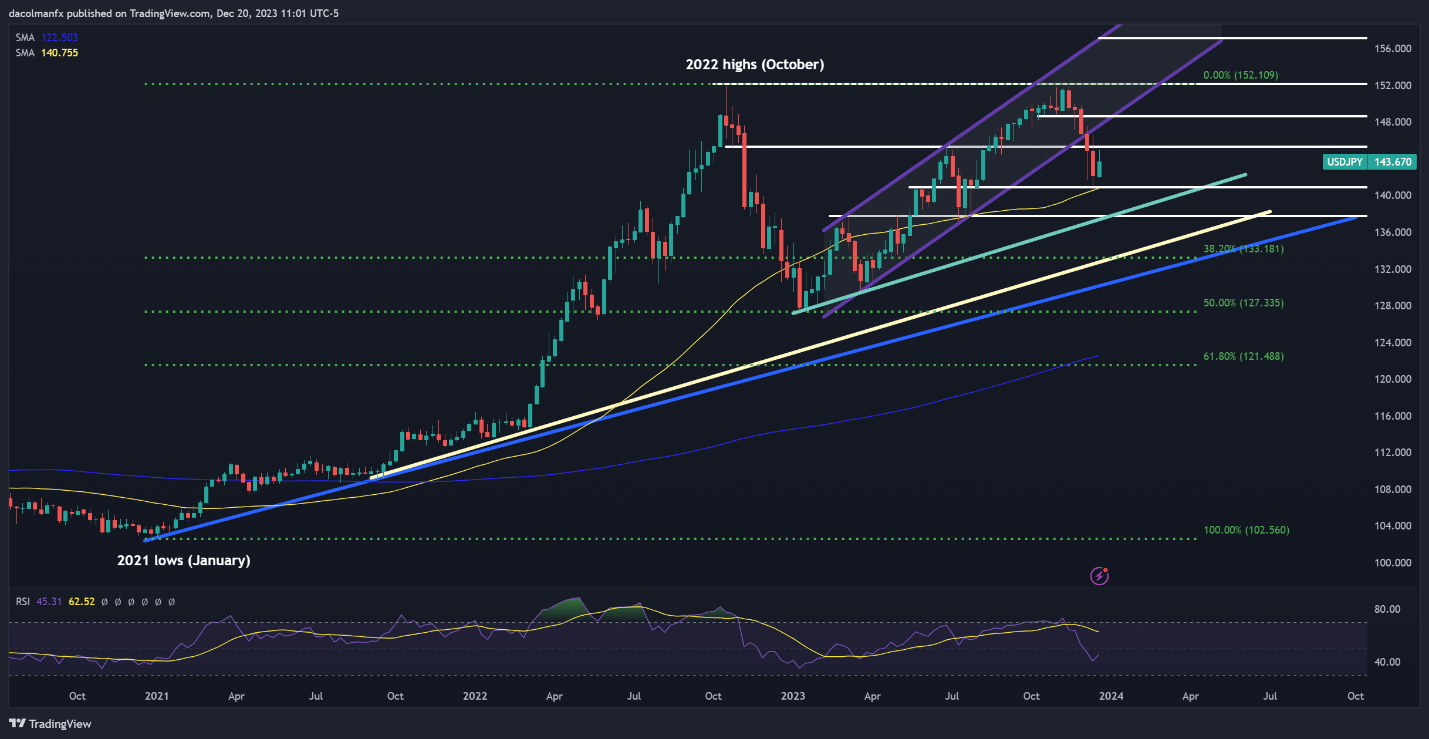
Source: TradingView, Prepared by Diego Colman
Access exclusive insights and tailored strategies for GBP/USD by requesting the British pound Q1 trading guide!
Recommended by Diego Colman
Get Your Free GBP Forecast
GBP/USD TECHNICAL ANALYSIS
GBP/USD rallied in the fourth quarter, hitting its best levels since late August and coming close to breaking through a Fibonacci threshold at 1.2765, denoting the 61.8% retracement of the 2021/2022 selloff (as of late December, this ceiling has not yet been breached). Heading into 2024, if cable manages to climb above this barrier, the focus will be on the 200-week simple moving average, followed by trendline resistance at 1.2900. On continued strength, buyers could be empowered to initiate an assault on 1.3145 and 1.3500 thereafter.
On the flip side, if the tide turns against the British pound and the U.S. dollar stages a comeback, GBP/USD might gradually decline towards technical support at 1.2450, near the 50-week simple moving average. Cable may bottom out in this region on a pullback before mounting a rebound, but if prices pierce through this floor, a descent toward trendline support at 1.2340 is conceivable. On persistent weakness, a retest of the October lows could be on the horizon, followed by 1.1800.
GBP/USD Weekly Chart
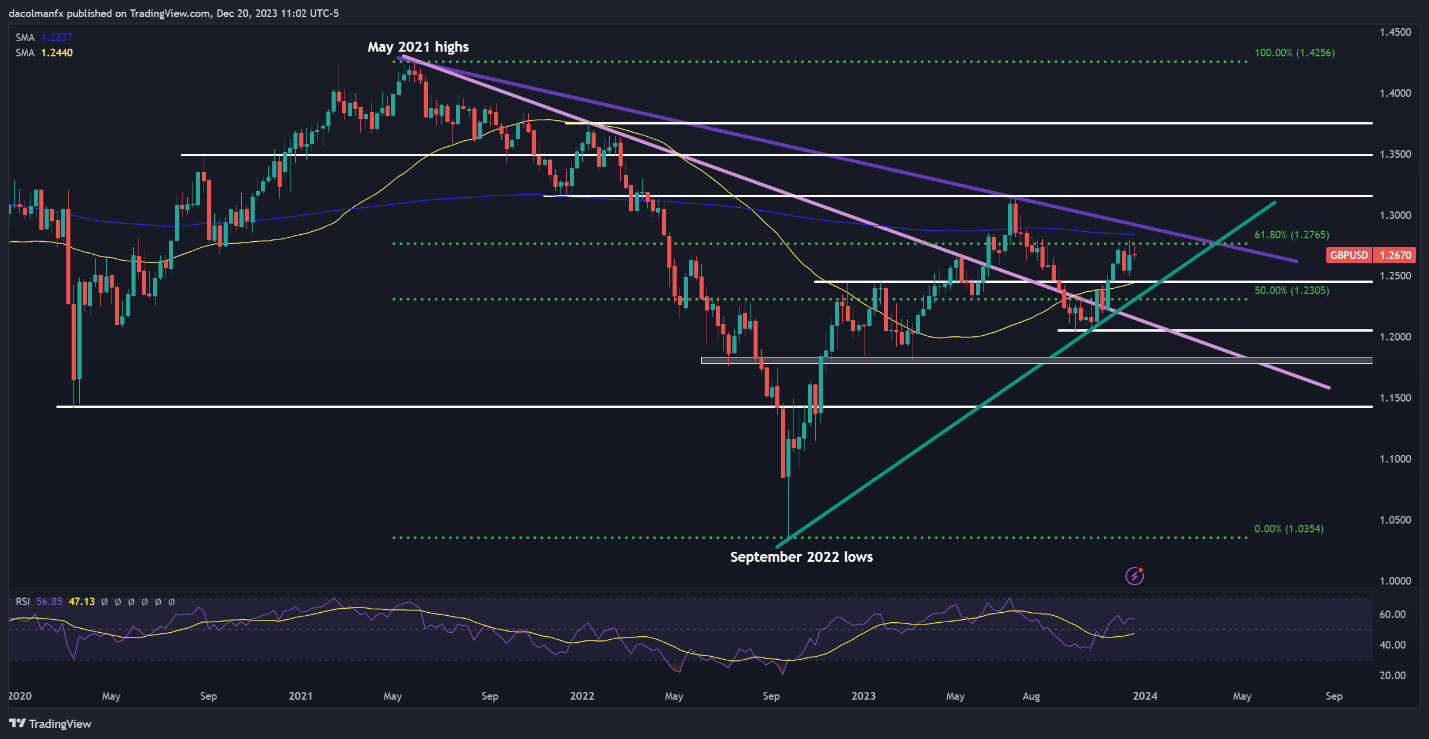
Source: TradingView, Prepared by Diego Colman