
Gold (XAU/UAS) Analysis
- Gold rises cautiously around key technical level (200 SMA)
- US yields remain elevated, capping gold gains thus far
- Silver attempts to test significant moving average
- The analysis in this article makes use of chart patterns and key support and resistance levels. For more information visit our comprehensive education library
Gold Rises Cautiously Around Key Technical Level
Gold hints at a continuation of the near-term upward direction but momentum is likely to be lacking until midweek when the crux of this week’s economic data is due. Markets are mainly focused on the FOMC rate decision and updated quarterly forecasts which can provide insight into the committees thinking around growth, inflation, and interest rates.
The FOMC is almost certain to keep rates unchanged according to the Fed funds futures market (99%) – opting to allow prior interest rate rises to work through the real economy as the committee maintain a data dependent approach.
Gold is likely to react to the value of the US dollar and US treasury yields in the aftermath of the statement, the updated figures and the press conference. The Fed is unlikely to alter their estimates of the terminal interest rate, allowing maximum flexibility in the event inflation rises further. The recent surge in oil prices adds to the challenges at the Fed, mainly reemerging inflation concerns.
Gold price action shows a modest rise to start the week, testing the 200-day simple moving average in the process. Gold has shown a tendency towards making lower highs and higher lows – presenting a narrowing range. $1937 is the most immediate level of resistance, roughly coinciding with trendline resistance. Support appears at $1915, followed by the swing low at $1901.
Gold (XAU/USD) daily chart
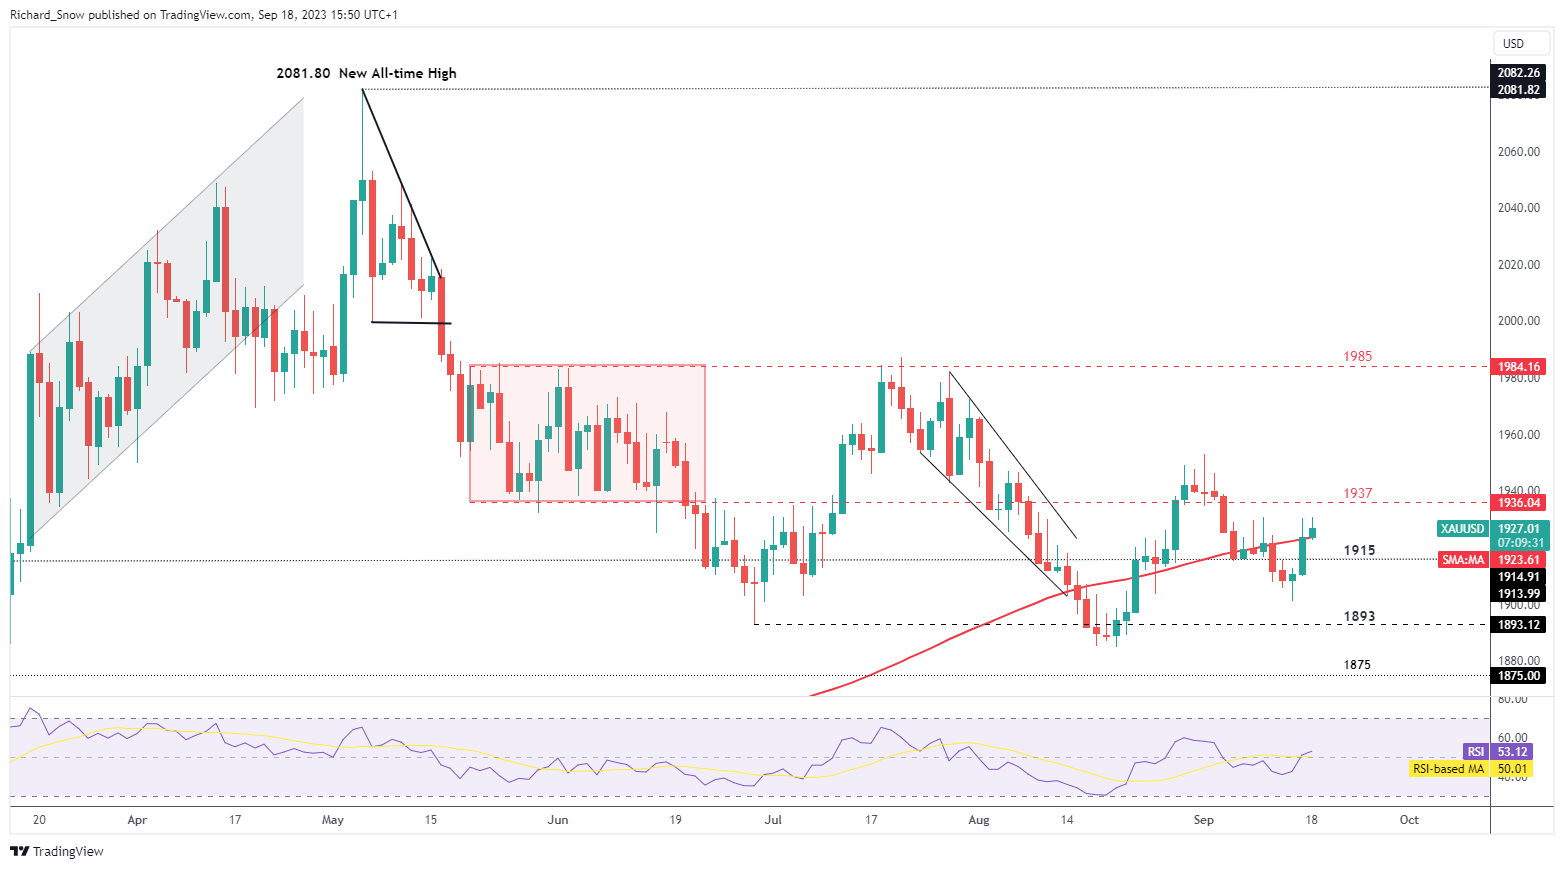
Source: TradingView, prepared by Richard Snow
The gold market is heavily influenced by a number of fundamental factors including interest rates and treasury yields. Read our guide below for further insight:
Recommended by Richard Snow
How to Trade Gold
US Yields Remain Elevated, Capping Gold Upside
US treasury yields have been edging higher as markets expect the Fed to maintain policy at restrictive levels for longer. As such, gold upside may come under pressure in the lead up to the Fed. Other central Banks like the Bank of England and Bank of Japan are also scheduled to decide on interest rates with no movement anticipated by the BoJ but markets favour a 25-bps hike on Thursday.
US 10-year treasury note yield
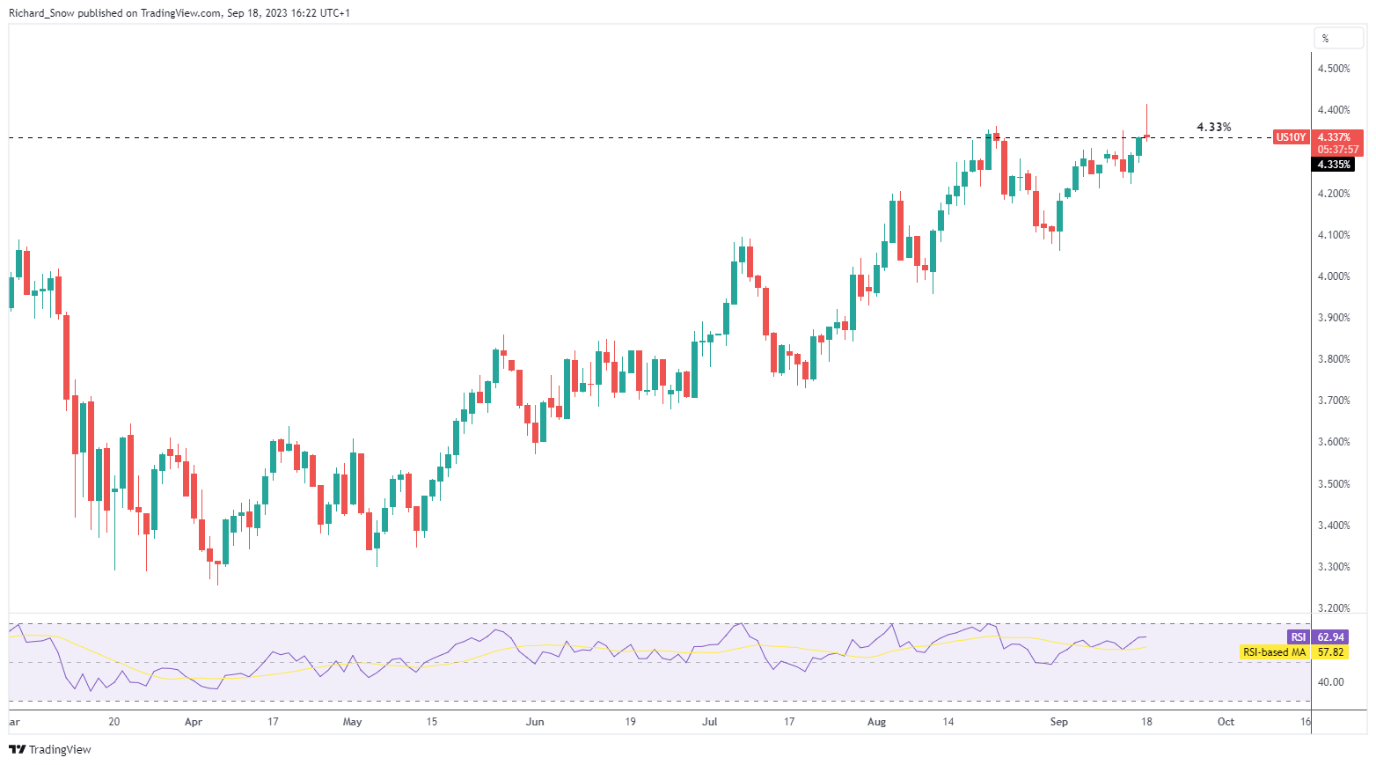
Source: TradingView, prepared by Richard Snow
The weekly gold chart reveals a slowdown in the longer-term downtrend, with price action piercing above the descending channel but with a low degree of conviction it must be said. A low volatility environment suggests that such breaks run the risk of fading. Could the FOMC decision be the catalyst needed to send the precious metal higher?
Gold weekly chart
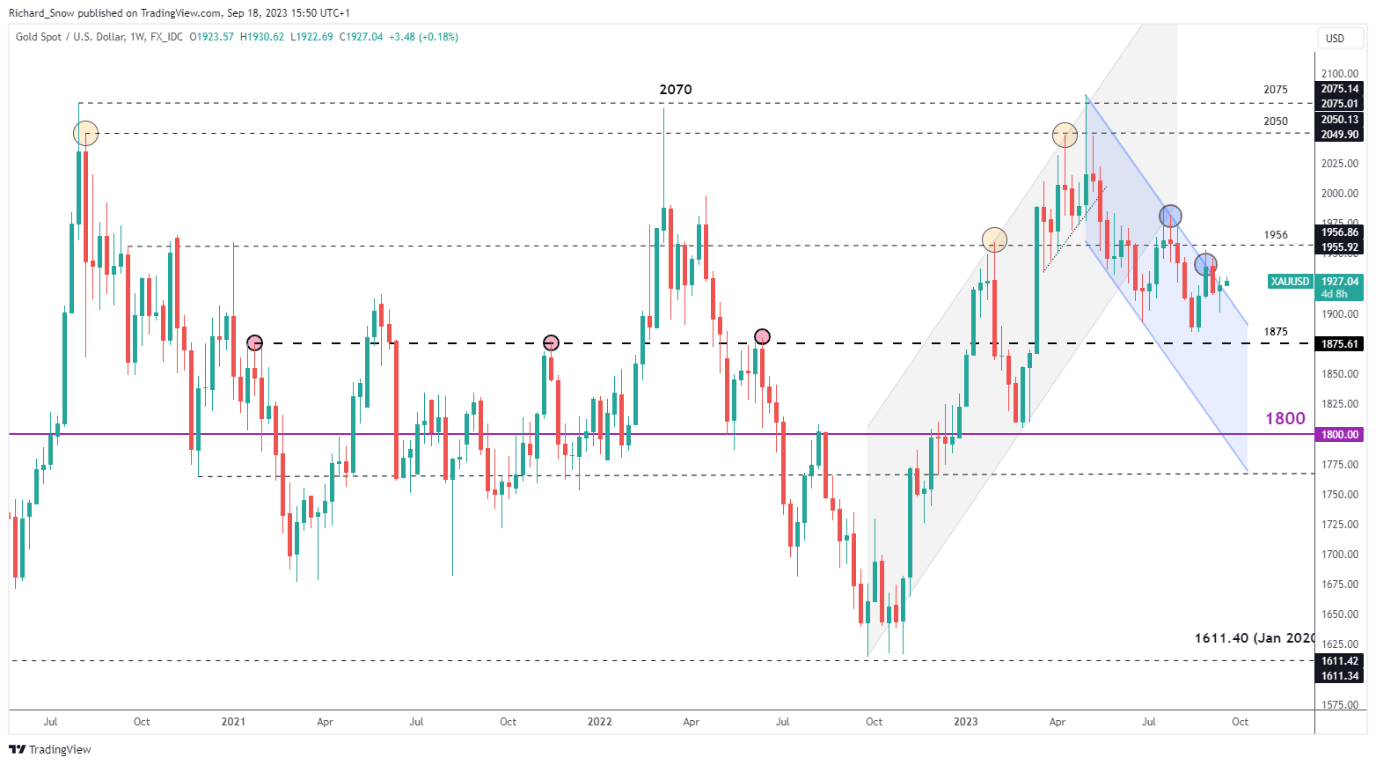
Source: TradingView, prepared by Richard Snow
Find out about the #1 mistake traders make and avoid it! Read the report below:
Recommended by Richard Snow
Traits of Successful Traders
Silver Attempts to Test Significant Moving Average
The silver chart has also revealed a bounce from the swing low around 23.20. The big test for the metal will be a retest of the 200 DMA but the market may require that catalyst preciously mentioned. Silver upside levels of interest appear via the 200 DMA followed by $24.65 a fair distance away.
Silver Daily Chart
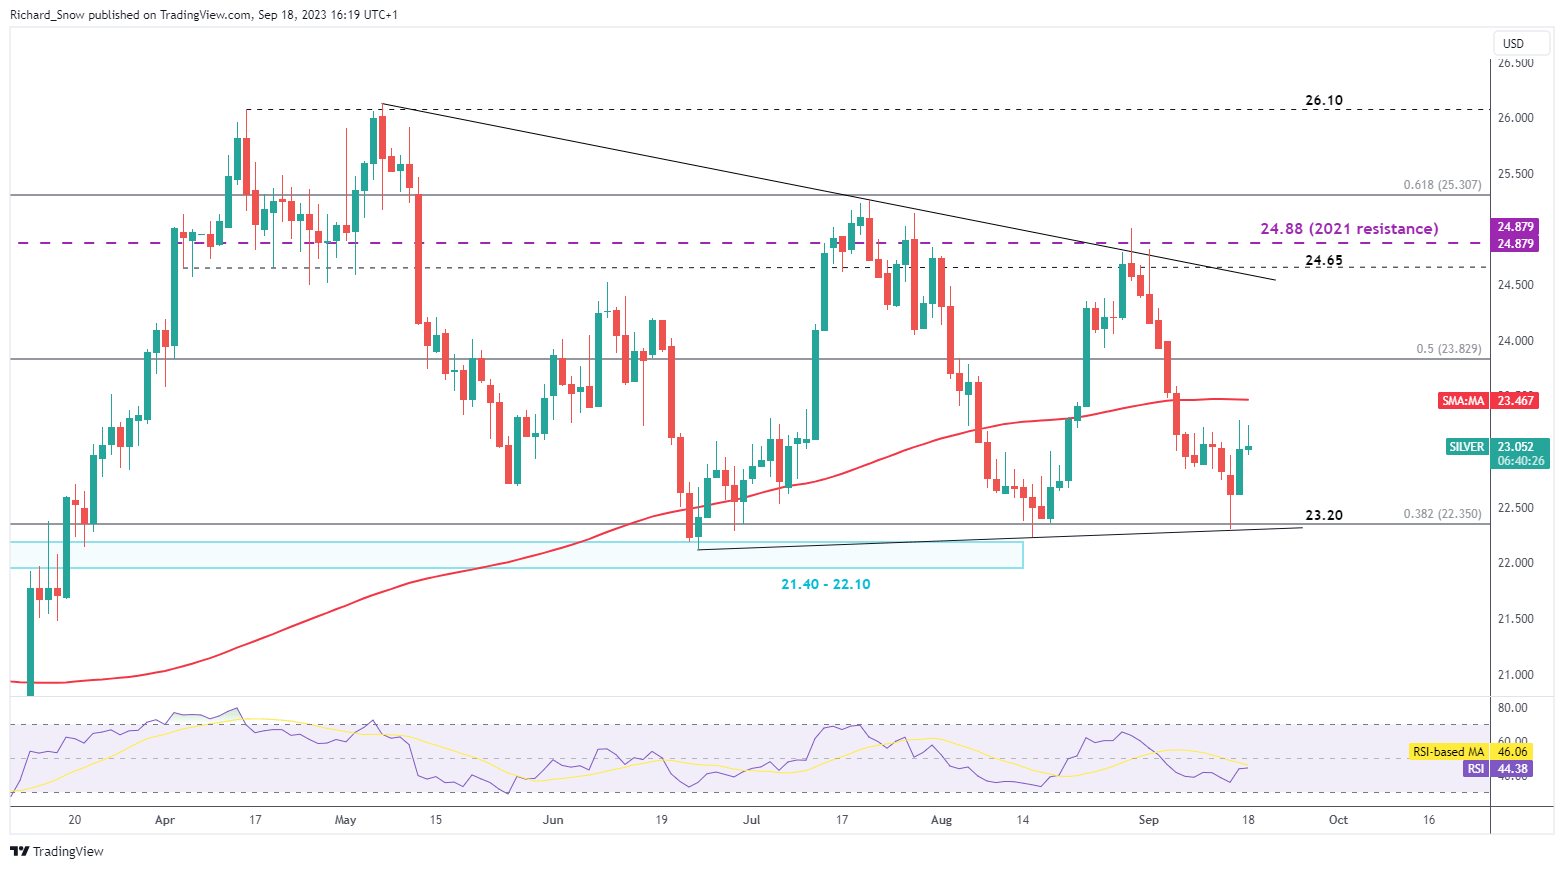
Source: TradingView, prepared by Richard Snow
Trade Smarter – Sign up for the DailyFX Newsletter
Receive timely and compelling market commentary from the DailyFX team
Subscribe to Newsletter
— Written by Richard Snow for DailyFX.com
Contact and follow Richard on Twitter: @RichardSnowFX