GOLD PRICES OUTLOOK:
- Gold prices may trade defensively in the near term, dragged down by rising U.S. Treasury yields and a strengthening U.S. dollar
- Treasury bond rates have been climbing rapidly this month amid a hawkish repricing of the Fed’s policy outlook
- This article looks at the key technical levels to keep an eye on in XAU/USD in the coming sessions
Recommended by Diego Colman
Get Your Free Gold Forecast
Most Read: Gold Prices Charge Toward Fibonacci Support as Markets Bet on Higher Fed Peak Rates
Gold prices (XAU/USD) have fallen by more than 5% in February, dragged down by the powerful rebound in real yields and the U.S. dollar. The chart below, in which the precious metal appears on an inverted scale, shows this strong relationship between these three assets since the beginning of the year.
GOLD PRICES, REAL YIELDS & US DOLLAR CHART
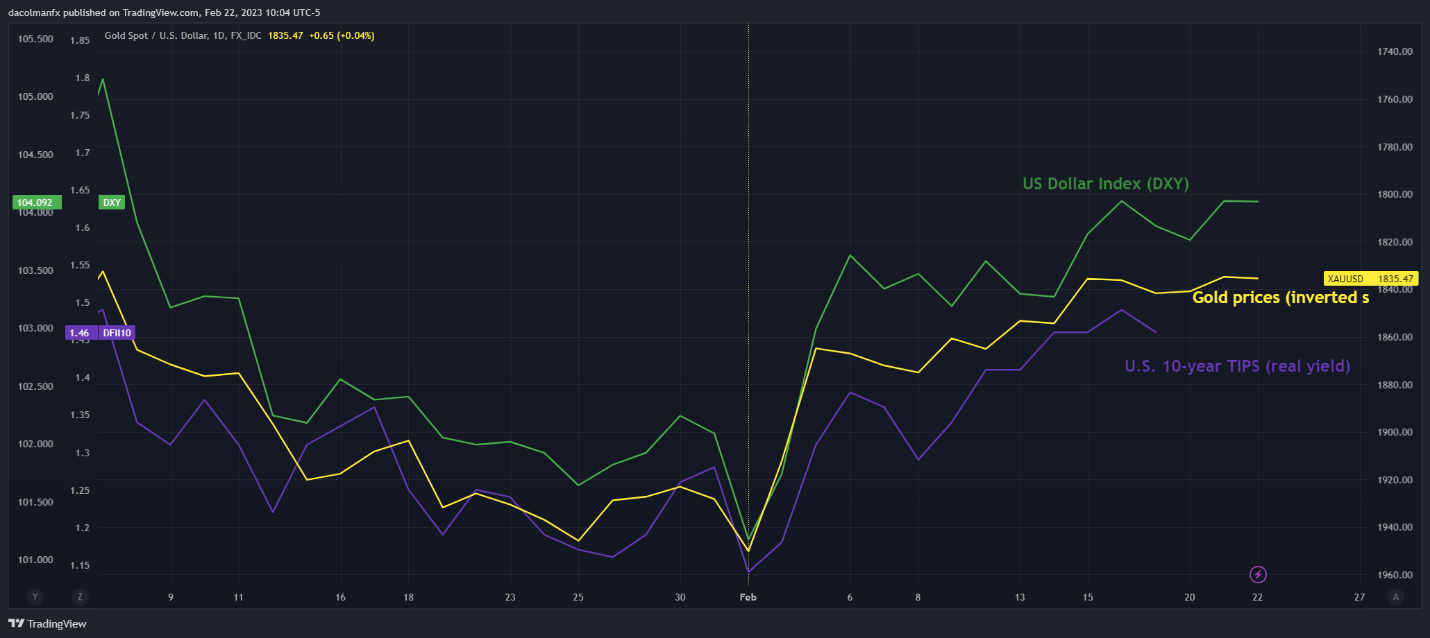
Source: TradingView
The recent dynamics in the currency and fixed income space are unlikely to reverse significantly anytime soon, so gold could remain biased to the downside in the near term.
Earlier in the year, traders were betting on a rapid downward shift in CPI, but inflationary forces have proven more sticky than initially anticipated thanks in part to a strong labor market. Persistently elevated CPI readings, coupled with the economy’s resiliency, has increased the risks that the FOMC will raise borrowing costs well above 5.00% and even resume hiking in a front-loaded fashion.
Fed futures contracts suggest the central bank’s terminal rate could peak around 5.35% this summer, but expectations could drift higher if demand-driven price pressures prevent a quick return to 2% inflation. This could delay a dovish pivot for the foreseeable future.
The increasingly hawkish hiking path, in concert with the higher-for-longer interest rate scenario, will act as a bullish driver for real yields, reinforcing the U.S. dollar’s recovery in financial markets. In this context, precious metals and rate-sensitive assets could adopt a defensive bias in the coming days and weeks. For all these reasons, the path of least resistance appears to be lower for gold.
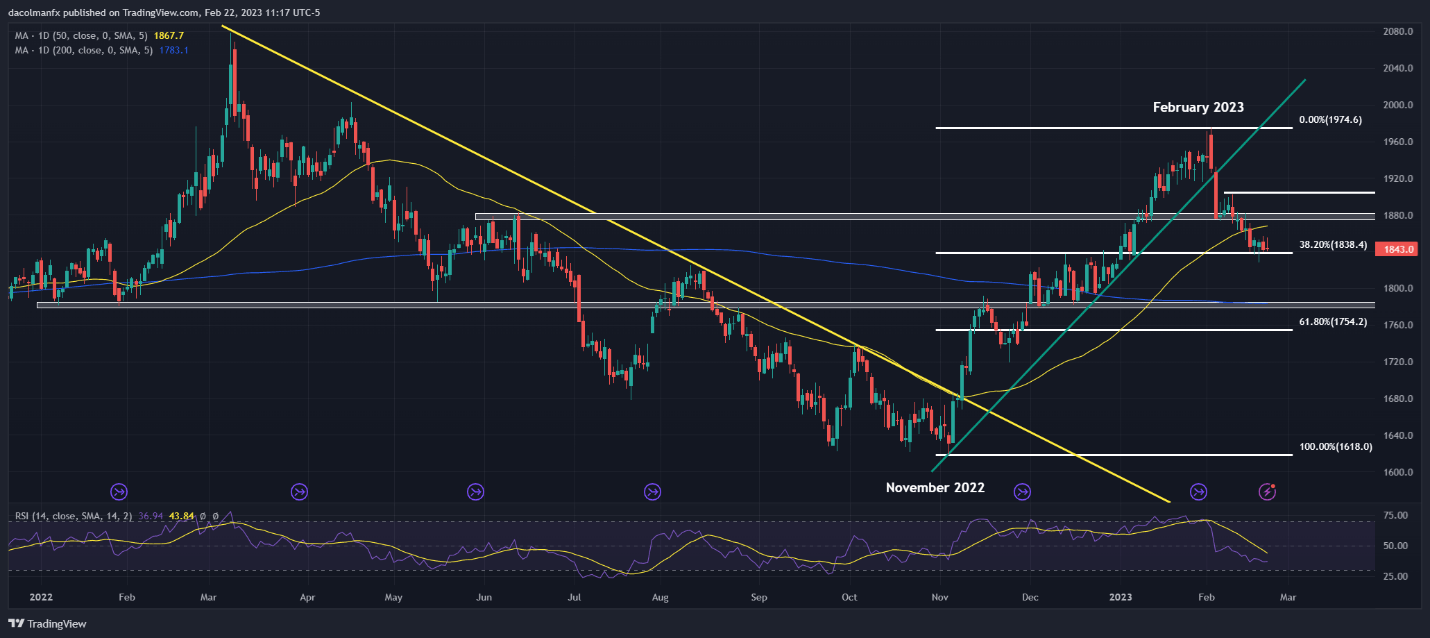
In terms of technical analysis, gold prices are hovering above a major support near $1,838 at the time of writing. This floor is defined by the 38.2% Fibonacci retracement of the November 2022/February 2023 upswing. If prices break below this area, selling activity could pick up steam, paving the way for a move towards the 200-day simple moving average, just a touch above $1,785.
On the flip side, if the bulls retake control of the market and trigger a meaningful bounce, the 50-day simple moving average could act as a soft resistance, followed by $1,880. Above this ceiling, the next resistance corresponds to the psychological $1,900 level.
| Change in | Longs | Shorts | OI |
| Daily | 1% | -4% | 0% |
| Weekly | -4% | -6% | -5% |
GOLD PRICES TECHNICAL CHART